

What the Bear Flag Pattern Actually Tells You
A Bear Flag is a bearish continuation pattern that shows up during a downtrend. It tells traders that the current pause in selling is likely temporary and that the price will probably keep falling. You can think of it as the market catching its breath before resuming its drop. The pattern gets its name because it looks like an upside-down flag hanging from a pole on a chart.
The pattern has three parts. The first is the flagpole, which is a sharp and fast drop in price caused by heavy selling pressure or a major news event. The second is the flag itself, a short period of consolidation where the price drifts slightly upward inside a small parallel channel. The third part is the breakdown, where the price breaks below the bottom edge of the flag and continues falling. This breakdown is usually confirmed by a jump in selling volume.
For advanced traders, the Bear Flag is one of the most reliable continuation setups in technical analysis. But its value goes beyond just pattern recognition. It also gives you a structured framework for setting entry points, stop-losses, and price targets. That said, the pattern only works well when it is confirmed by volume, momentum indicators, and the broader market context.
The Psychology Behind the Bear Flag
Every chart pattern reflects human behavior, and the Bear Flag is no different. After a steep price drop, a group of short-term buyers steps in. These are often bargain hunters who believe the asset is now "cheap." Their buying creates a slow, upward drift in price, which forms the flag portion of the pattern.
But here is the key detail. The buying during this phase is weak. Volume drops significantly compared to the flagpole, which shows that there is not enough conviction to reverse the trend. At the same time, sellers are still sitting at higher price levels, waiting for the right moment to push prices down again.
This is where many less experienced traders get trapped. They see the upward consolidation and assume the trend is reversing. Technical traders, on the other hand, recognize this pullback for what it is: a pause inside a larger downtrend. The sellers still have control, and once the consolidation runs out of steam, they take over again and drive the price lower.
How to Tell a Bear Flag Apart From Similar Patterns
One of the biggest challenges in chart reading is telling one pattern from another. Several formations look similar to a Bear Flag, but each one behaves differently and carries different implications.
Bear Flag vs. Bull Flag
Both are continuation patterns with the same structure. The difference is direction. A Bull Flag forms during an uptrend and has a downward-sloping consolidation. A Bear Flag forms during a downtrend and has an upward-sloping consolidation. The structure is mirrored, but the logic is the same.
Flag vs. Pennant
In a flag, the consolidation forms a rectangular channel with parallel trendlines. In a pennant, the trendlines converge into a small symmetrical triangle. Pennants tend to resolve faster and are often seen as more aggressive because the breakout usually happens earlier.
Bear Flag vs. Descending Triangle
A Descending Triangle has a flat support level with lower highs pressing down toward it. A Bear Flag, by contrast, keeps its boundaries parallel and usually slopes slightly upward.
Bear Flag vs. Rising Wedge
A Rising Wedge features two converging trendlines that both slope upward. While both patterns can lead to bearish breakdowns, the internal structure and the angle of the trendlines are different.
Getting these distinctions right matters a lot. Misidentifying a pattern can lead to poorly timed entries or false confidence in a setup that does not actually exist.
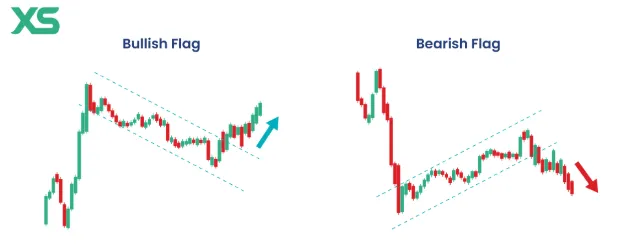
Image from XS
How to Measure the Price Target
One of the most practical aspects of the Bear Flag is that it gives you a built-in method for estimating where the price could go after the breakdown. This approach is called the measured move technique.
To use it, you first measure the height of the flagpole. That means calculating the distance from the top of the initial drop to the bottom of it. Then, you take that same distance and project it downward from the point where the price breaks below the flag's lower boundary. The result is your estimated price target.
There are also a few reliability guidelines that can help you filter out weaker setups. A Bear Flag is considered most trustworthy when the consolidation does not retrace more than 50% to 62% of the original flagpole. If the price pulls back beyond that range, the pattern loses its structural integrity, and the odds of a successful breakdown decrease.
Studies suggest that the Bear Flag has a success rate of roughly 65% to 70% when it is confirmed by proper volume behavior and supported by the overall market trend. That is a solid hit rate, but it also means that about one in three setups will fail, which is why risk management is critical.
Real-World Examples
The Bear Flag has shown up across multiple asset classes and timeframes. Below are some of the most notable recent examples.
Bitcoin (November 2021 to June 2022)
Bitcoin dropped sharply from its all-time high near $69,000, forming a clear flagpole. The price then consolidated upward toward roughly $48,000 over several weeks, creating the flag. Once the lower boundary broke, Bitcoin continued its decline and eventually hit yearly lows near $17,990. This was a textbook Bear Flag that played out over several months.
U.S. Dollar Index / DXY (2020 to 2021)
The DXY fell from around 103 to 91, forming a strong flagpole. It then consolidated upward toward 100 before breaking down again and reaching lows near 89. This pattern took close to a year to fully resolve, which highlights how these formations can stretch across long timeframes in traditional markets.
Tesla (Late 2020)
During a period of heavy capital rotation into tech stocks, Tesla formed a multi-day flag pattern. It served as a continuation setup that aligned with the broader trend of the time. The pattern was clean and widely referenced in technical analysis discussions.
SOLS on Gate.io (Short Timeframe)
On a 30-minute chart, SOLS experienced a high-volume surge after a listing event. The price consolidated briefly and then broke out to continue higher. While this was technically a Bull Flag rather than a Bear Flag, it belongs to the same structural family and demonstrates how flag patterns work on much shorter timeframes.
These examples show that the Bear Flag is not limited to one market or one timeframe. It appears in crypto, forex, equities, and indices, and it works on everything from 30-minute charts to weekly charts.
Bear Flag vs. Bull Flag: Side-by-Side Comparison

What Makes the Pattern Fail
No pattern is perfect, and the Bear Flag comes with real risks that advanced traders need to account for. The biggest one is the false breakdown.
A false breakdown happens when the price briefly dips below the lower boundary of the flag but then reverses sharply back into or above the consolidation range. This can happen for a few reasons. Sometimes the selling volume at the breakdown point is just too low to sustain the move. Other times, it is the result of deliberate market manipulation by larger players.
This brings up the concept of predatory trading. Large market participants are fully aware that Bear Flags are popular among retail traders. They know where the stop-loss orders are likely clustered, and they can push the price just far enough to trigger those stops before reversing direction. In crypto markets especially, this kind of behavior is common because of the relatively thin liquidity compared to traditional finance.
To protect against false breakdowns, traders should look for the following confirmation signals:
- A clear increase in volume at the moment of the breakdown
- RSI or other momentum indicators supporting the bearish continuation
- The broader market trend aligning with the pattern's expected direction
- No major support levels sitting immediately below the breakdown point
Without these confirmations, acting on a Bear Flag breakdown is essentially a gamble.
How Crypto Markets Change the Rules
The Bear Flag behaves a bit differently in crypto compared to traditional markets, and it is important to understand why.
Traditional stock markets have opening and closing hours. Price gaps can form overnight or over the weekend, and these gaps often serve as the starting point of a flagpole. Crypto markets, on the other hand, run 24 hours a day, seven days a week. There are no gaps. Instead, flagpoles are built from continuous active trading, which often makes them smoother but also more volatile.
Crypto also tends to resolve flag patterns much faster. A Bear Flag that might take weeks to play out in equities can form and complete in just a few days in crypto. This faster pace means that traders need to monitor their positions more actively and set tighter risk parameters.
Another important difference is the rise of new analytical tools. Platforms now offer on-chain analysis capabilities that let traders validate patterns using wallet activity, exchange flows, and liquidation data. AI-driven tools in forex and crypto are also becoming more common, and they add another layer of confirmation beyond just looking at the chart.
How to Use the Bear Flag Without Getting Trapped
The Bear Flag is more than a shape on a chart. It is a map of seller dominance that gives traders a structured approach to entering and exiting positions during a downtrend. But the structure alone is not enough. The pattern only becomes actionable when it is confirmed by multiple factors working together.
Volume needs to drop during the flag and spike during the breakdown. Momentum indicators like RSI should support the bearish direction. The broader market context, including macroeconomic conditions and sector trends, should align with the trade. And the consolidation should stay within the 50% to 62% retracement range of the flagpole to keep the pattern valid.
When all of these pieces line up, the Bear Flag offers one of the cleanest risk-to-reward setups in technical analysis. But when even one piece is missing, the odds shift, and the pattern can easily become a trap set by institutional players. The difference between a successful trade and a costly mistake often comes down to patience and confirmation, not just pattern recognition.
