Author: LBank Research Analyst: Ludo
1. Core Conclusion
Overall judgment: Medtronic is a strong diversified medical-device franchise, but its equity is approximately fairly valued with a mildly negative near-term risk/reward skew at the November 17 close of USD 102.32. The decisive variable is earnings and cash conversion from the retained portfolio after MiniMed separation. Hugo strengthens the long-term opportunity; it does not yet justify a robotics premium across the entire company.
-
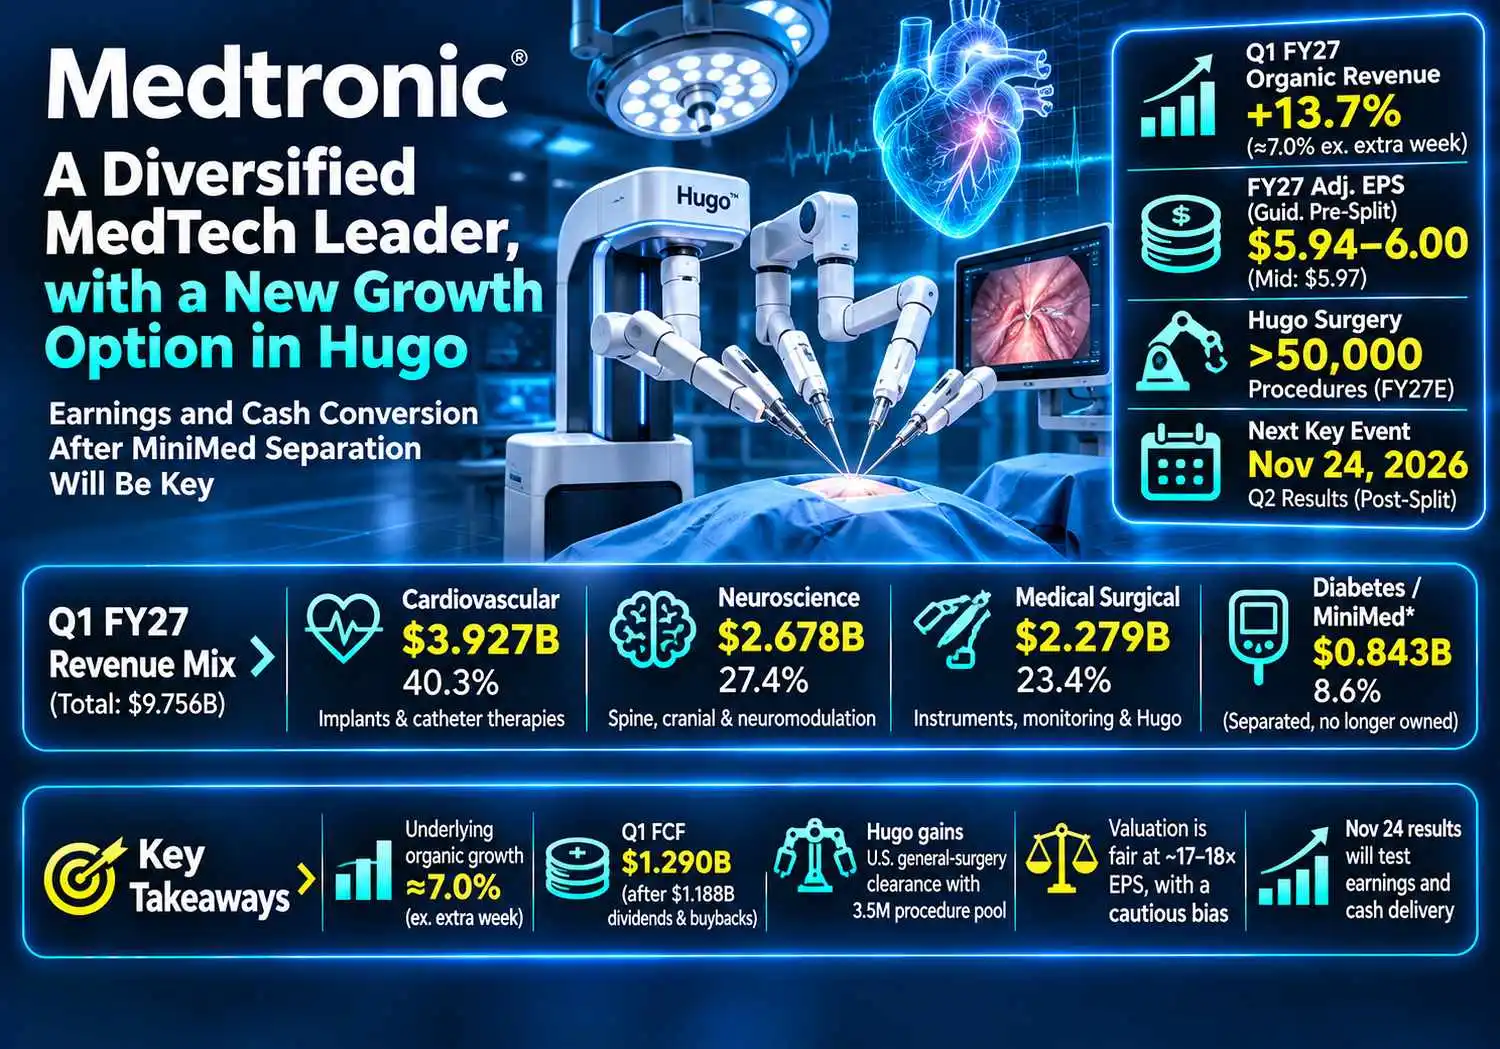
Growth is improving, although the headline overstates its speed. Q1 FY27 organic revenue rose 13.7%, including approximately USD 570 million from an extra fiscal week. Subtracting that amount from the organic revenue schedule gives roughly 7.0% underlying growth. That supports a quality recovery thesis, while making continued double-digit growth an unsuitable baseline.
-
The relevant earnings denominator has changed. September guidance was non-GAAP FY27 EPS of USD 5.94–6.00, before completion of the October split-off. Its USD 5.97 midpoint produces an apparent 17.1x multiple. We use USD 5.75 as an explicitly hypothetical normalized post-separation EPS and 18x as an analyst-selected multiple, implying USD 103.50, only 1.2% above the reference close. This is a valuation sensitivity, not fresh company guidance or a price target.
-
Hugo offers a credible expansion option with limited immediate earnings weight. The November 17 general-surgery clearance covers a U.S. procedure pool the issuer estimates at 3.5 million annually. Medtronic expects global Hugo procedures to exceed 50,000 by fiscal year-end. These are different geographic and clinical scopes. They cannot be divided to calculate market share; hospital utilization and recurring instruments will determine monetization.
-
Cash generation is stronger, but capital allocation absorbs much of it. Q1 FCF was USD 1.290 billion. Dividends and cash-flow-statement repurchases totaled USD 1.188 billion, leaving USD 102 million before acquisitions. The proposed USD 380 million Contego purchase is strategically coherent but expected to be minimally dilutive in FY27–FY28. Growth spending must earn an adequate return.
-
November 24 is a comparability test before it is a headline EPS test. Q2 ended October 30, after the October 15 separation. Continuing operations, the diluted share denominator and stranded costs must be reconciled. Our bull sensitivity is USD 6.10 EPS at 20x, or USD 122.00; the bear is USD 5.40 at 16x, or USD 86.40. Those represent +19.2% and −15.6% price sensitivities, excluding dividends, without assigned probabilities.
2. Company Overview, Business Mix, and Core Operating Metrics
Medtronic plc is an Ireland-domiciled, NYSE-listed medical-device company. Its retained economic engine combines implantable devices, procedure-specific consumables, surgical equipment and related service. Hospitals and clinical teams select technologies; reimbursement and purchasing arrangements influence demand and pricing. Clinical evidence, physician training and installed equipment support repeat use, although none guarantees a captive customer. The investment case depends on recurring clinical activity translating into profitable sales rather than on the number of product announcements.
The three retained portfolios address different purchasing cycles. Cardiovascular is the primary incremental growth driver. Neuroscience provides a broad procedural base, including spine and cranial technologies, specialty therapies and neuromodulation. Medical Surgical combines established instruments and monitoring products with the emerging Hugo platform. Equipment placements can initially consume commercial resources; recurring instruments become more valuable when procedure volumes rise.
|
Business / historical Q1 FY27 scope
|
Revenue, USD million
|
Share of historical group
|
Economic role
|
|
Cardiovascular
|
3,927
|
40.3%
|
Implants and catheter-based therapies; largest growth engine
|
|
Neuroscience
|
2,678
|
27.4%
|
Cranial, spine, specialty therapies and neuromodulation
|
|
Medical Surgical
|
2,279
|
23.4%
|
Surgical instruments, monitoring and Hugo expansion
|
|
Diabetes / MiniMed
|
843
|
8.6%
|
Historical consolidation; no remaining equity ownership after separation
|
|
Other
|
29
|
0.3%
|
Transition and exited-business activity
|
Historical business mix uses the September release and sums to USD 9.756 billion. The retained portfolios total USD 8.884 billion; this subtraction is a perimeter illustration, not a restated continuing-operations financial statement. Revenue contribution does not imply equal profit contribution: portfolio-level costs, corporate allocations and separation arrangements matter. We do not infer segment operating margins from revenue weights.
Core operating metrics and changes
The extra week is the most important calendar adjustment. Using the issuer’s organic schedule, (9,652 − 570) / 8,489 − 1 = 6.99%. This approximate normalization assumes the stated extra-week estimate can be deducted directly; it is not a company-reported comparable-week KPI. It also cannot be allocated precisely to the retained portfolios without additional disclosure.
|
Metric / event
|
Verified observation
|
Research interpretation
|
|
Q1 calendar
|
14-week versus 13-week comparison; extra week approximately USD 570 million
|
Normalize growth before extrapolation
|
|
Q1 organic growth by portfolio
|
Cardiovascular 18.9%; Neuroscience 9.3%; Medical Surgical 10.2%
|
All include the extra week; not comparable-week growth
|
|
October 15 split-off
|
55,032,401 MDT shares accepted; no MiniMed equity stake retained
|
Earnings numerator and share denominator both change
|
|
November 16 Contego announcement
|
USD 380 million plus potential post-acquisition payments; expected FY27 Q3 closing
|
Minimally dilutive adjusted EPS in FY27–FY28
|
|
November 17 Hugo clearance
|
General surgery; approximately 3.5 million U.S. annual procedures in covered categories
|
Addressable procedure pool, not booked sales
|
|
November 24 results
|
Q2 FY27 ended October 30; release 5:45 a.m. CT; webcast 6:30 a.m. CT
|
Reconcile continuing operations and guidance first
|
Contego extends a pre-existing U.S. distribution relationship into intended ownership. The economic rationale is deeper participation in carotid and peripheral vascular treatments, using an existing commercial network. However, the announced consideration does not represent the entire potential lifetime payment, and management anticipates near-term EPS dilution. We therefore include it as an investment demand on capital, without inventing target-company revenue or near-term synergies.
3. Fundamental Quality
Quality assessment: strong clinical franchises and improving cash generation; moderate financial flexibility and an earnings-comparability discount. The following historical comparison preserves the original consolidated scope. Both quarters precede the completed split-off. It is useful for evaluating the quality of the reported improvement, while providing an imperfect starting point for future continuing earnings.
|
Metric
|
Q1 FY26
|
Q1 FY27
|
Assessment
|
|
Revenue, USD million
|
8,578
|
9,756
|
Calendar benefit inflates growth
|
|
GAAP operating margin
|
16.8%
|
18.1%
|
Improvement exceeds adjusted expansion
|
|
Non-GAAP operating margin
|
23.6%
|
23.7%
|
Only 10 basis points expansion
|
|
GAAP net income attributable to MDT, USD million
|
1,040
|
1,470
|
Not the same as consolidated net income
|
|
GAAP diluted EPS, USD
|
0.81
|
1.14
|
Historical consolidated basis
|
|
Non-GAAP diluted EPS, USD
|
1.26
|
1.45
|
Adjustments remain material
|
|
Operating cash flow, USD million
|
1,088
|
1,793
|
Collections and payment timing matter
|
|
Capital expenditure, USD million
|
504
|
503
|
Property, plant and equipment additions
|
|
FCF, USD million
|
584
|
1,290
|
Operating cash flow minus capital expenditure
|
|
FCF / adjusted net income
|
35.9%
|
69.4%
|
Improving; not a full-year conversion forecast
|
|
Cash and current investments, USD billion
|
9.220 (April 24, 2026)
|
8.819 (July 31, 2026)
|
Balance-sheet dates differ from flow comparison
|
|
Total debt, USD billion
|
28.0 (April 24, 2026)
|
28.2 (July 31, 2026)
|
Historical balance sheet before split-off
|
The adjusted net-income denominators are USD 1.626 billion and USD 1.860 billion. FCF improved faster than revenue, while capital expenditure was essentially flat. This is encouraging: the company did not require proportionate investment in physical assets to capture every incremental sale. Yet the 10-Q attributes part of operating cash-flow improvement to lower taxes and litigation payments. A recurring operating improvement and a favorable payment calendar deserve different valuation treatment.
The gap between GAAP EPS and adjusted EPS is also economically meaningful. Amortization and restructuring can be excluded from a measure of current operating performance, but repeated acquisitions consume capital and can generate new amortization or integration costs. Investors should judge whether the acquisition program creates value after its cash outlays, rather than capitalizing every adjustment indefinitely. The modest adjusted margin improvement supports operational discipline, not a claim that profitability has entered a new structural range.
Net debt, using cash plus current investments, was approximately USD 19.4 billion at July 31. Liquidity is meaningful, but the company is not a net-cash compounder. Q1 acquisition outlays of USD 1.162 billion were excluded from conventional FCF. After subtracting those outlays as well, only USD 128 million remained before dividends and repurchases. This alternative cash view explains why a respectable FCF number can coexist with limited capacity for simultaneous acquisitions, distributions and debt reduction.
A reproducible operating-to-value bridge
For an illustrative annual sensitivity, assume the retained operating perimeter generates USD 35 billion of revenue, grows 7%, converts incremental revenue at a 30% operating contribution margin and faces a 17% tax rate. These are analyst assumptions, not management forecasts. Incremental revenue is 35 × 7% = USD 2.45 billion; incremental operating profit is 2.45 × 30% = USD 735 million; incremental after-tax operating profit is 735 × 83% = USD 610 million. If 80% becomes incremental FCF after reinvestment and working capital, incremental FCF is USD 488 million.
With an assumed diluted share base of 1.23 billion, that profit sensitivity equals approximately USD 0.50 per share. At 18x earnings, the associated equity-value sensitivity is approximately USD 9.00 per share, holding financing costs and the multiple constant. This is an incremental bridge, not an additional uplift to stack on top of our base case: the normalized EPS scenarios already reflect a view of operating performance. The model shows why sustained retained-business growth matters more than isolated clearance announcements.
Separation-adjusted earnings sensitivities
The base EPS assumption has a transparent, deliberately simplified origin: start with the old USD 5.97 guidance midpoint, assume an 8% reduction in attributable earnings from lost Diabetes profit and residual costs, and a 4.3% reduction in shares. The latter is proxied by 55.032401 million accepted shares divided by 1,279.137890 million shares outstanding on August 28. Then 5.97 × 92% / 95.7% is approximately USD 5.74, rounded to USD 5.75 for the scenario.
The 8% earnings reduction is unverified and is the central model uncertainty. Spot shares and weighted-average diluted shares are different measures, and the mid-October transaction will have only a partial-period effect in Q2. This calculation must therefore never be presented as a forecast of Q2 EPS or as a restated annual guide. At the reference price, normalized base EPS implies 17.8x. The fair-value base uses an assumed 18x, while stronger operating execution and clean separation support the bull multiple of 20x; weaker growth and stranded costs support the bear 16x. Multiple selection is research judgment, not a claimed observed peer median.
The single most important variable is retained-business earnings growth after stranded corporate costs. If that growth is durable, recurring cash flow can support a higher valuation even without a dramatic Hugo revenue contribution. If EPS growth mainly reflects a smaller denominator, the same multiple will overstate the improvement in enterprise economics.
4. Industry and Competitive Landscape
Medical devices are several clinical markets rather than a single addressable industry. A surgical robot competes for hospital capital and operating-room capacity; ablation products compete on clinical performance, workflow and physician adoption; implants compete within distinct indications and reimbursement systems. Medtronic’s scale supports distribution and research, but an aggregate revenue comparison does not establish product-level market leadership.
|
Competitive arena
|
Relevant evidence / scale
|
Valuation implication
|
|
Diversified retained devices
|
MDT historical retained portfolios: USD 8.884 billion quarterly sales
|
Breadth supports resilience; calendar and scope require normalization
|
|
Robotic surgery
|
Intuitive: USD 3.05 billion Q3 sales and 546 da Vinci placements
|
Incumbent scale makes rapid displacement an aggressive assumption
|
|
Hugo expansion
|
Issuer forecasts more than 50,000 global procedures by FY27 end
|
Evidence of adoption; no clean market-share denominator
|
|
Cardiovascular competition
|
Boston Scientific EP organic sales growth −5.3% in Q3
|
Near-term opening for rivals; period and business scope differ
|
|
Broad medical devices
|
Abbott Medical Devices Q3 sales USD 5.826 billion; comparable growth 7.8%
|
Provides a diversified growth benchmark, not a direct stock multiple
|
|
Company / comparison period
|
Revenue / KPI
|
Growth / margin
|
Competitive reading
|
|
Medtronic plc — Q1 FY27 ended July 31
|
Group sales USD 9.756 billion; retained portfolios USD 8.884 billion
|
Group organic +13.7%; adjusted operating margin 23.7%
|
Recovering; extra week and historical Diabetes included
|
|
Intuitive Surgical, Inc. — Q3 ended September 30
|
Sales USD 3.05 billion; instruments and accessories USD 1.80 billion
|
Sales +22%; da Vinci procedures approximately +14%
|
Clear robotics scale winner; GAAP margin distorted by litigation
|
|
Boston Scientific Corporation — Q3 ended September 30
|
Sales USD 5.138 billion; EP USD 816 million
|
Organic +1.5%; adjusted operating margin 26.5%
|
Near-term underperformer; disruption and competition limit clean share inference
|
|
Abbott Laboratories — Q3 ended September 30
|
Medical Devices sales USD 5.826 billion
|
Device comparable growth +7.8%; reported +6.9%
|
Diversified device grower; group results include non-device businesses
|
These are approximate-scope comparisons, not synchronized market-share calculations. Medtronic’s fiscal quarter ended two months before the peers’ calendar quarter and includes an extra week. Its Electrophysiology Therapies category is broader than Boston Scientific’s EP category. A subtraction of their revenues or growth rates would manufacture a competitive conclusion that the disclosures cannot support.
Intuitive is winning in installed infrastructure and recurring robotic instruments. Its scale creates a training, workflow and service hurdle for Hugo, even when hospitals want another supplier. Boston Scientific is the near-term relative loser in the selected data: weak EP growth and lower cash generation reduce operating momentum. Abbott remains a credible diversified competitor. Medtronic is a net beneficiary of broader procedural demand and additional supplier choice, although current evidence does not prove that its organic recovery is mostly share capture.
The Hugo commercialization sequence should be clearance, hospital adoption, utilization, recurring consumable revenue and finally incremental profit. An addressable procedure count enters at the beginning of that sequence. It says little about procurement timing or utilization in existing sites. Our base case credits optionality while requiring clinical and commercial progress before applying an Intuitive-like narrative to the whole Medtronic equity.
5. Key Risks
-
Separation earnings reset. If lost Diabetes earnings plus stranded costs exceed our assumed 8% earnings reduction, share retirement may not offset the numerator loss. Normalized EPS and the justified multiple would fall together. A clean reconciliation is more important than an isolated headline beat.
-
Calendar normalization disappoints. If comparable-period retained organic growth falls below 5%, investors may recognize that Q1 strength was disproportionately calendar-driven. Slower revenue absorption would pressure margins and make the 18x base multiple harder to defend.
-
Hugo utilization lags clearance. If hospitals postpone purchases or procedure activity grows without sufficient recurring instrument revenue, commercialization spending precedes returns. The approval narrative could then lift expectations faster than cash earnings, increasing valuation risk.
-
Price and procurement pressure. If reimbursement constraints or centralized purchasing reduce realized prices faster than volume improves, nominal procedure growth will not translate into revenue or incremental contribution. Product mix must offset pricing pressure for the operating bridge to hold.
-
Cash absorption and acquisition execution. If FCF conversion returns below 60% of adjusted net income over a sustained comparable period while acquisitions continue, distributions may compete with debt reduction. Contego integration, contingent payments or additional acquisitions could constrain financial flexibility.
-
Device quality and regulatory interruption. A material recall, adverse clinical evidence or delayed regulatory permission could reduce procedure adoption while increasing remediation and litigation outlays. The transmission would affect revenue, margins and cash simultaneously; diversification reduces concentration without eliminating this risk.
6. Monitoring Checklist
-
November 24, Q2 FY27: obtain the continuing-operations reconciliation, treatment of Diabetes and explicit post-separation annual guidance. Unexplained scope differences weaken the thesis even if EPS exceeds a vendor estimate.
-
Retained organic revenue growth: 7% or better on a comparable-calendar basis supports our operating bridge; below 5% weakens it. These are research thresholds, not company commitments.
-
Normalized EPS: a supported continuing-business run rate around USD 5.75 or higher validates the base sensitivity; below USD 5.40 points toward the bear case. Check numerator growth separately from shares.
-
Adjusted operating margin: use historical 23.7% only after perimeter adjustment. At least 50 basis points of comparable expansion would strengthen operating leverage; contraction would weaken it.
-
FCF conversion: seek at least 70% of adjusted net income on a comparable multi-quarter basis, with improving inventory and receivables. Below 60% raises cash-quality concerns.
-
Hugo adoption: monitor the issuer’s more-than-50,000 global procedure expectation for fiscal year-end, utilization per active hospital and recurring instrument disclosure. Procedure growth without monetization is insufficient.
-
Contego and capital allocation: watch expected FY27 Q3 closing, disclosed additional payments and dilution relative to the stated minimal effect. Faster accretion supports the case; material cash overspend weakens it.
Material data boundaries. The latest completed financial period verified is Q1 FY27; Q2 results were not available at this research cutoff. Historical guidance predates completed separation. No verified, scope-consistent post-separation consensus, options-implied move or segment profit allocation is used. The source pages differ on vendor forward valuation measures, so valuation here is calculated from disclosed historical guidance and labeled research scenarios. LBank’s opened HTTP interfaces expose contract controls but no live numerical quote; no futures price is presented as the stock close. The reported stock reference is November 17 regular-session trading, not a November 18 live quote.
7. Sources
-
-
-
-
-
-
-
-
-
Intuitive Announces Third Quarter Earnings (https://isrg.intuitive.com/news-releases/news-release-details/intuitive-announces-third-quarter-earnings-6) — 2026-10-20; quarter ended September 30; GAAP and non-GAAP distinguished.
-
Q3 2026 Financial and Operational Highlights (https://investors.bostonscientific.com/~/media/Files/B/Boston-Scientific-IR-V3/FOH/q3-2026-foh.pdf) — 2026-10-28; Boston Scientific sales, organic growth, margins and cash flow.
-
-
-
-
MDTUSDT Futures Trading | LBank Futures (https://www.lbank.com/futures/mdtusdt) — 2026-11-18 HTTP page inspection: MDTUSDT Perp, Stocks tag, chart, order book, trades and mark/index/funding controls present; price placeholders.
-
-
-
-
-



 Chuyển khoản