


 Transferência
K-Line charts show a trading pair’s price movements over different time intervals. Each K-Line displays the opening, closing, highest, and lowest prices for a given interval. You can use K-Lines alongside technical indicators to analyze market trends.
This guide explains how to read and customize K-Line charts using the Futures page in the LBank App.
How to View a K-Line Chart
-
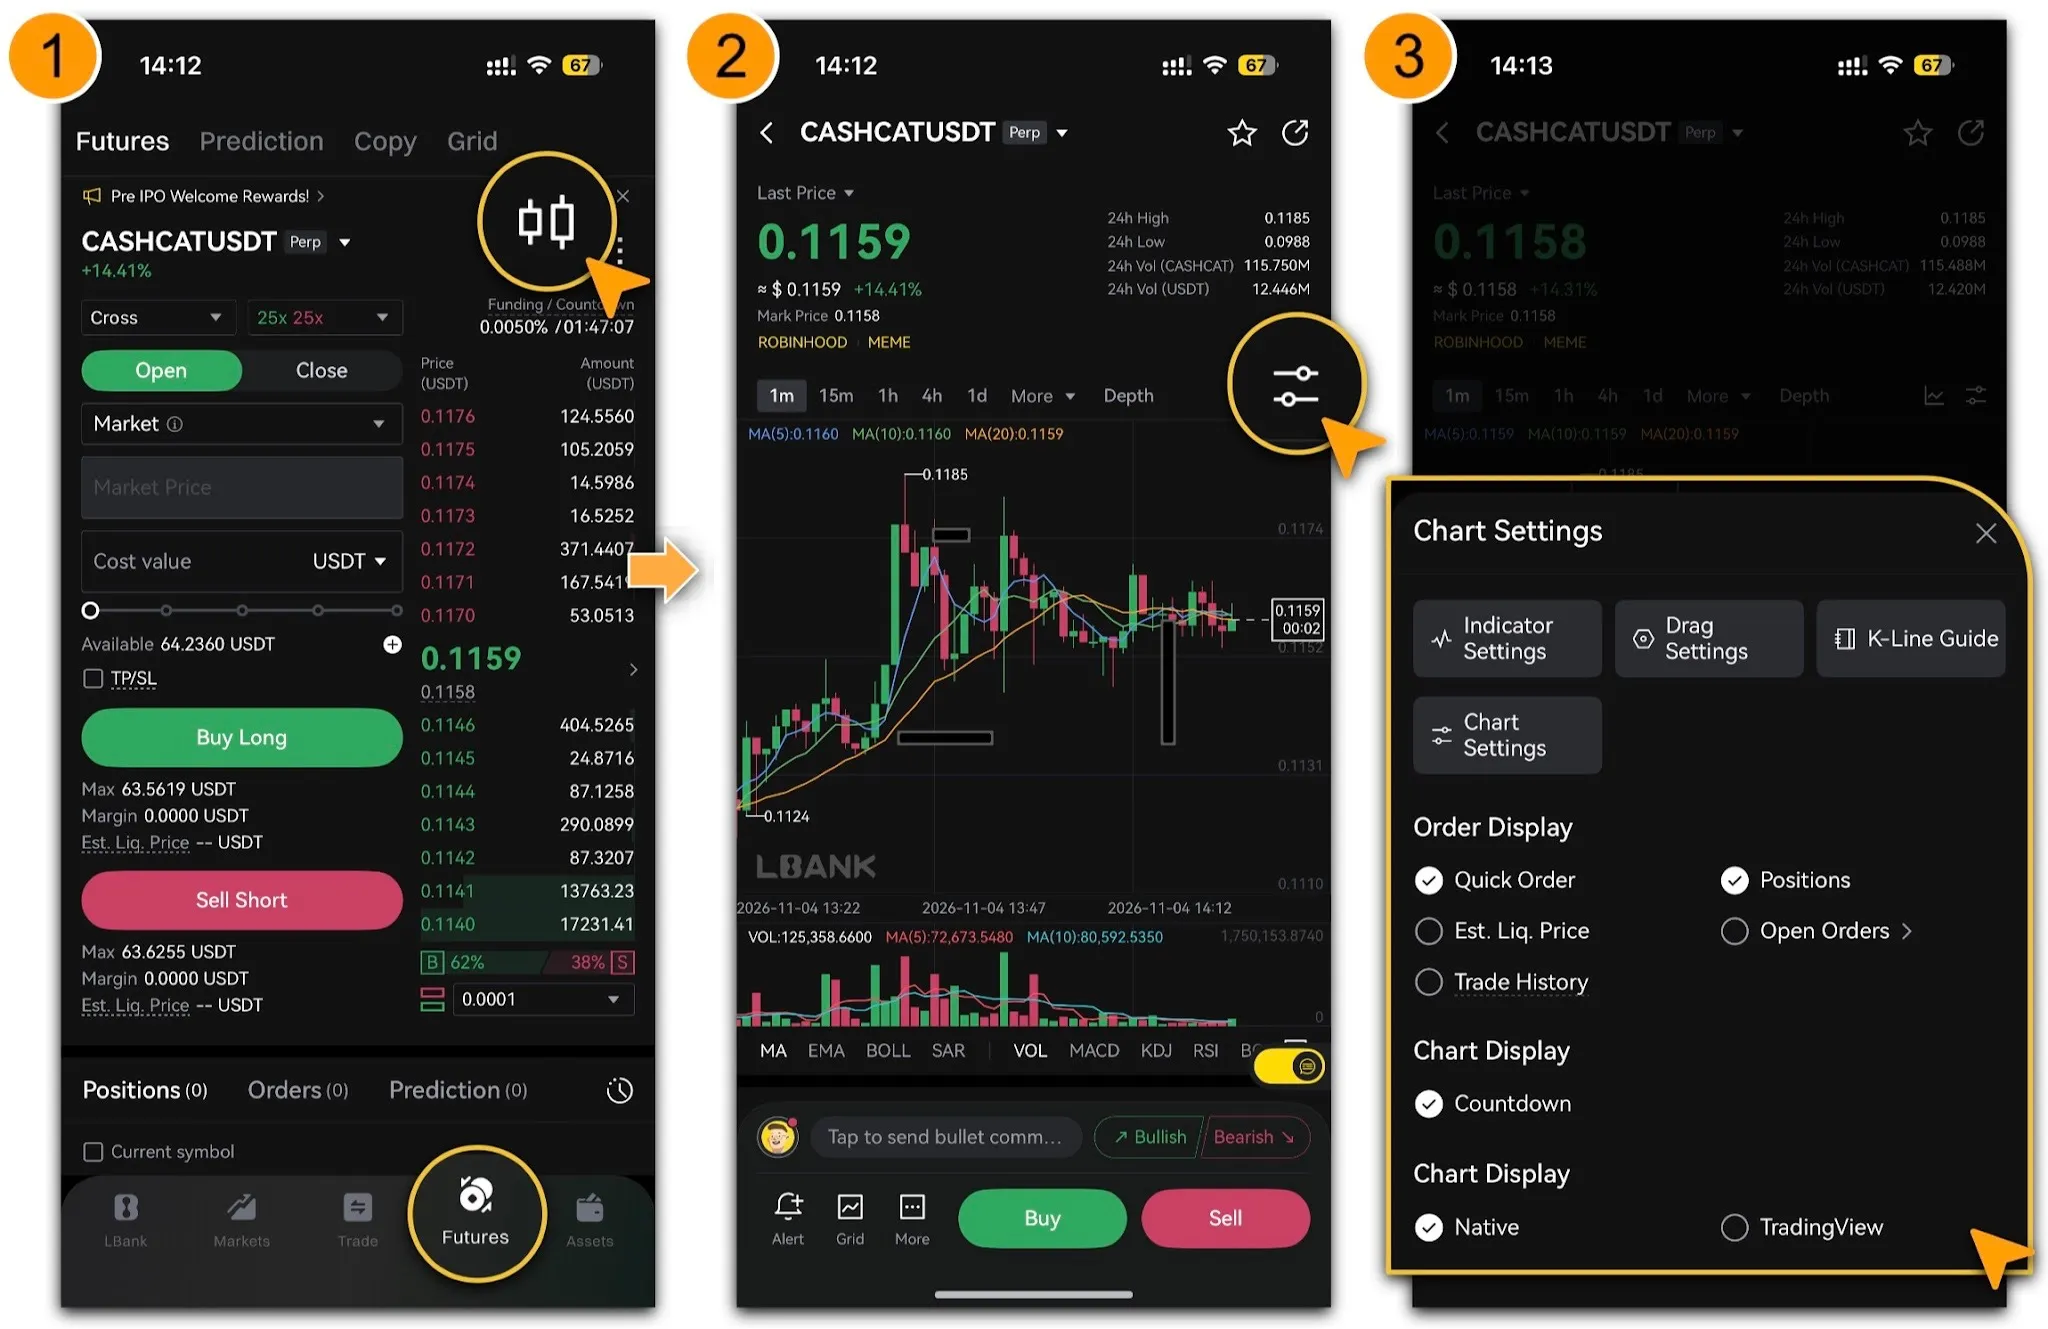
Open the LBank App, log in to your account, and go to「Futures.
-
Select the trading pair you want to view to open its trading page.
-
Tap the chart icon in the upper-right corner, as shown below, to view the K-Line chart and related market data.
-
Above the chart, you can view the last price, mark price, 24-hour high, 24-hour low, trading volume, and trading turnover.
📌Note: The 24-hour market data and an individual K-Line cover different time periods. Make sure to distinguish between them.
How to Read a K-Line
-
Each K-Line represents a specific time interval and contains four prices:
-
A K-Line consists of a body and wicks:
-
Typically, a green K-Line indicates that the closing price is higher than the opening price, while a red K-Line indicates that the closing price is lower. The actual colors depend on your chart settings.
-
The current K-Line continues to update until its interval ends. Its body, wicks, and color may change as the traded price moves. For example,
-
Suppose a 1-hour K-Line has the following prices
-
The K-Line’s body and wicks cover the following ranges:
Note: These figures are for illustration only and do not represent actual market prices
How to Change the K-Line Interval
-
Above the chart, tap [1m], [15m], [1h], [4h], or [1D] to change the interval.
-
Tap [More] to view additional intervals.
-
The selected interval determines the time represented by each K-Line, not the time range of the entire chart.
-
Switch between intervals to view the same trading pair’s price movements across different timeframes.
How to Customize the K-Line Chart
Tap the settings icon in the upper-right corner of the chart to open「Chart Settings」. Available features may vary by chart version. Refer to the options shown in your App.
Indicator & Chart Settings
-
The「Chart Settings」panel provides access to the following options:
-
For example, MA(5), MA(10), and MA(20) represent moving averages calculated over 5, 10, and 20 periods of the selected K-Line interval. They do not necessarily represent days.
-
Note: Technical indicators are calculated using historical market data. They are for analytical reference only and do not guarantee future price movements.
Adjust Order Display Settings
-
Under [Order Display], select or clear the following options to show or hide the corresponding features or information on the chart:
-
Quick Order
-
Current Positions
-
Estimated Liquidation Price
-
Open Orders
-
Trade History
-
To further customize how open orders are displayed, tap the arrow to the right of「Open Orders」.
Switch Chart Versions
-
Under「Chart Display」, select「Native」or「TradingView]」to switch chart versions.
-
To use the K-Line countdown, first switch to [TradingView].
Turn the K-Line Countdown On or Off
-
The K-Line countdown shows the time remaining until the current K-Line closes.
-
To enable it:
-
Tap the settings icon in the upper-right corner of the chart to open [Chart Settings].
-
Under [Chart Display], select [TradingView], then countdown will be auto enabled.
-
Close the settings panel to view the countdown on the chart.
-
For example, if you select the [15m] interval and the countdown shows “02:30,” the current 15-minute K-Line will close in 2 minutes and 30 seconds. It does not mean that a new 15-minute interval starts from that moment. Please note:
-
The K-Line countdown is available only in TradingView mode.
-
The countdown corresponds to the currently selected K-Line interval.
-
To turn it off, clear「Countdown」.
What Should You Keep in Mind When Using K-Line Charts?
-
Distinguish between closed and unclosed K-Lines: The current K-Line continues to change until its interval ends. Do not treat its shape as final before it closes.
-
Confirm the trading pair and interval: Price trends may differ across trading pairs and intervals. Check both before analyzing the chart.
-
Avoid relying on a single signal: K-Lines and technical indicators do not guarantee future price movements. Do not make trading decisions based solely on one K-Line or indicator.
-
Understand the risks of futures trading: Futures trading involves leverage and liquidation risk. K-Line analysis is not a substitute for managing margin, positions, and trading risk.
Reminder
This article is for product information and educational purposes only and does not constitute financial advice. Digital asset trading involves significant risk and price volatility. Make sure you understand the applicable trading rules and risks, and trade cautiously based on your risk tolerance.
The App interface and available features may change with updates. Refer to the latest version of the App for the actual interface and available options.