Author: LBank Research Analyst: Ludo
Disclaimer: This report is compiled and analyzed from publicly available information and is intended solely for information sharing and research discussion. It does not constitute investment advice, a securities recommendation, a trading instruction, or any guarantee of returns. The company operations, valuations, market prices, and consensus expectations discussed herein may change over time. Readers should independently verify the data and make their own decisions.
1. Core Conclusion
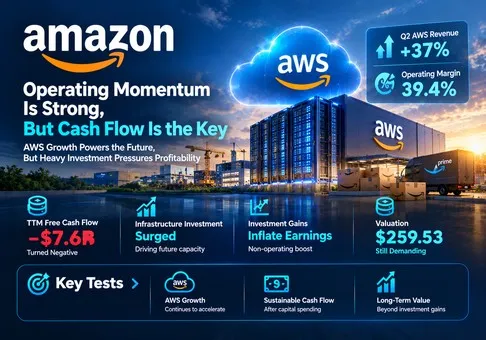
Overall judgment: Amazon.com, Inc. is a strong business with improving operating economics, but its equity valuation is demanding rather than demonstrably cheap. The risk/reward bias is cautious at the October 12 close of USD 259.53. The decisive variable is how much cash AWS and the commerce ecosystem retain after infrastructure investment, not the size of investment-related GAAP profit.
-
The operating engine has accelerated. AWS revenue grew 37% in Q2 and its operating margin reached 39.4%. This supports a positive business assessment: incremental workload demand is translating into operating profit. It does not establish that the next investment cycle will earn an equally attractive return.
-
Reported earnings overstate the recurring run rate. Q2 net income of USD 62.647 billion included USD 53.415 billion of pretax other income, primarily investment gains. At the equity close, the reported TTM EPS of USD 12.44 implies approximately 20.9x earnings. That multiple provides weak evidence of cheapness because those gains cannot be assumed to recur.
-
Cash investment has outrun operating cash growth. TTM operating cash flow was USD 161.403 billion, while net equipment purchases were USD 169.007 billion, producing negative FCF of USD 7.604 billion. The business can generate cash before investment while still requiring outside financing after it.
-
A cleaner earnings proxy shows a higher hurdle. Applying an analyst-assumed 25% tax rate to TTM operating income and dividing by Q2 diluted shares gives USD 6.45 per share, or approximately 40.3x at the reference price. This is an after-tax operating earnings proxy, not GAAP EPS or a company non-GAAP measure; it excludes interest and investment income. Even annualizing Q2 operating income gives approximately 34.3x on the same basis. Sustained growth is already required.
-
October product launches strengthen the demand path, not the near-term cash forecast. The October 5 AWS roundup described a Managed Agents preview, and October 8 coverage described the Physical AI Toolchain. Neither provides a disclosed incremental revenue figure. These developments increase the relevance of AWS to future workflows, but warrant no automatic addition to a financial forecast.
Using July 22 basic shares outstanding of 10.786 billion and the October 12 close produces an indicative equity capitalization of USD 2.799 trillion. This uses the latest verified filing share count, not a real-time capitalization feed. At an illustrative 30x recurring net earnings multiple, that capitalization requires USD 93.312 billion of annual net earnings. A simplified 25% tax conversion would require USD 124.417 billion of operating earnings before allowing for net interest, 32.8% above current TTM operating income. The multiple and tax rate are analyst assumptions, not targets or consensus.
A separate cash hurdle is equally informative: a 4% FCF yield on that capitalization requires approximately USD 111.975 billion of sustainable annual FCF. This is not a forecast. It makes explicit how much of the operating cash generation would have to survive the investment program for a conventional cash-yield valuation to look comfortable.
2. Company Overview, Business Mix, and Core Operating Metrics
Amazon combines regional commerce platforms with a global cloud business. Its economic advantage should be assessed through customer demand, fulfillment density, seller participation and enterprise workload consumption. A consolidated revenue multiple obscures the different capital requirements and margins across these activities.
North America and International encompass commerce and associated services in their respective geographies. Amazon earns product revenue from goods it sells itself, fees from third-party sellers, subscription revenue and advertising revenue. Retail scale can create useful network effects, but shipping, inventory and customer service remain real costs. Advertising and seller services are monetization layers within the geographic businesses; they are not separate reportable operating segments.
AWS earns revenue from compute, storage, databases and other cloud services. Consumption can expand when customers run additional workloads, retain more data or deploy applications more broadly. Conversely, greater efficiency per task can reduce usage unless lower costs stimulate enough new demand. The relevant question is paid workload expansion and retained economics rather than technical capability alone.
|
Business / Q2 2026
|
Revenue, USD billion
|
Operating income, USD billion
|
Economic role
|
|
North America
|
116.177
|
9.123
|
Commerce, seller fees, subscriptions and advertising; regional profitability
|
|
International
|
42.197
|
1.717
|
Regional commerce and services; logistics density and local execution
|
|
AWS
|
42.232
|
16.621
|
Compute, storage, databases and managed services; enterprise consumption
|
|
Total
|
200.606
|
27.461
|
Advertising is included in geographic segments; do not add it again
|
The figures reconcile to the consolidated statements. North America plus International plus AWS equals total revenue and operating income. Advertising revenue must not be added to these segment totals. Segment operating income is also different from standalone cash flow: allocating costs to a segment does not reveal its full investment requirement.
Core operating metrics and changes
|
Metric
|
Q2 2025
|
Q1 2026
|
Q2 2026
|
Interpretation
|
|
AWS revenue, USD billion
|
30.873
|
37.587
|
42.232
|
Acceleration plus sequential expansion
|
|
AWS operating margin
|
32.9%
|
37.7%
|
39.4%
|
Improved utilization / mix; future depreciation remains relevant
|
|
Advertising revenue, USD billion
|
15.694
|
17.243
|
19.809
|
Commerce monetization alongside cloud
|
|
Paid-unit growth, YoY
|
12%
|
15%
|
17%
|
Demand strengthened; excludes Whole Foods Market
|
|
Third-party seller unit mix
|
62%
|
60%
|
61%
|
Unit mix, not share of revenue
|
|
Consolidated operating margin
|
11.4%
|
13.1%
|
13.7%
|
Better operating economics before investment gains
|
The combination of growth and margin is stronger evidence than either variable alone. A company can buy growth through discounts or expand margins by deferring investment. Amazon's recent operating figures support an interpretation of improved demand and operating execution, while its cash statement shows the cost of building for future demand.
AWS's Q2 revenue increased approximately 12.4% from Q1. That sequential progression reduces the likelihood that the year-over-year acceleration is only a weak comparison effect. However, a run rate calculated by multiplying one quarter by four remains a reference point, not a full-year forecast. Capacity timing, customer commitments and seasonal consumption can change the next quarters materially.
Advertising adds another route from commerce demand to earnings. The economic hypothesis is that more shopping activity improves advertiser utility and seller conversion, supporting greater monetization of existing traffic. That hypothesis should be tested against customer experience and seller profitability. Excessive ad density or higher seller fees could undermine the same ecosystem that generates the revenue.
The July guidance for Q3 calls for revenue of USD 197–202 billion and operating income of USD 22.5–26.5 billion. The simple midpoint operating margin is approximately 12.3%: 24.5 divided by 199.5. This is below the Q2 margin, illustrating why extrapolating the latest quarter is aggressive. The company also identified Prime Day timing as a material growth-comparison effect. The guidance is a July management outlook, not a confirmed Q3 result or our forecast.
October's agent and robotics developments matter because they potentially deepen recurring usage across compute, storage and deployment. An open-source toolchain can attract workloads without directly charging for the software. The financial benefit would come from associated paid cloud consumption and customer retention. Launch visibility, downloads and technical demonstrations cannot substitute for evidence of paying customers and durable unit economics.
3. Fundamental Quality
|
Financial metric, USD billion unless stated
|
FY2025 / Dec. 31
|
Latest / June 30, 2026
|
Definition
|
|
Revenue
|
716.924
|
775.680
|
FY2025 versus latest TTM
|
|
Operating income
|
79.975
|
93.712
|
FY2025 versus latest TTM; GAAP
|
|
Net income
|
77.670
|
135.281
|
FY2025 versus latest TTM; investment marks included
|
|
Diluted EPS, USD
|
7.17
|
12.44
|
FY2025 versus latest TTM; GAAP
|
|
Operating cash flow
|
139.514
|
161.403
|
FY2025 versus latest TTM
|
|
Net cash purchases of property and equipment
|
128.320
|
169.007
|
FY2025 versus latest TTM; net of sales and incentives
|
|
Free cash flow
|
11.194
|
-7.604
|
Operating cash flow less net cash equipment purchases
|
|
Cash plus marketable securities
|
123.029
|
122.988
|
Balance-sheet snapshots; not all investments
|
|
Long-term debt, excluding current portion
|
65.648
|
128.894
|
Balance-sheet carrying amount; excludes leases
|
Historical annual figures and latest TTM figures cover different endpoints. Balance-sheet rows are point-in-time observations. FCF follows Amazon's disclosed definition and does not subtract all acquisitions, investments, lease principal or debt service. It should not be described as total cash available to distribute without further adjustments.
Growth quality is strong; cash conversion after investment is weak. The key tension is that earnings and operating cash can improve at the same time that infrastructure absorbs even more cash. This is not automatically evidence of poor investment decisions, but it shifts valuation support from current distributable cash toward future returns on assets still being built.
The balance sheet offers substantial liquidity, while borrowing has increased materially. Cash and marketable securities therefore should be considered alongside debt, leases and investment commitments. An investment holding can be valuable without being readily available to fund the next equipment order. Equally, an unrealized gain can improve reported net income without providing the cash needed for that order.
Investment gains require consistent treatment. Removing them from recurring earnings does not mean assigning the investments zero asset value. Their potential value belongs in a separately justified asset valuation, including uncertainty, liquidity and taxes. Counting both the gain as recurring profit and the entire investment as an additional asset would double count part of the economics.
Capital allocation is consequently the main unresolved quality test. The operating franchise has demonstrated profitability; the next question is whether the marginal infrastructure dollar produces satisfactory lifetime cash returns. Growth in booked or consumed workloads helps, but an adequate return also depends on pricing, equipment life, energy costs, financing and how quickly assets reach useful utilization.
A reproducible business-to-cash transmission chain
Consider an illustrative next-year sensitivity using the Q2 AWS annualized revenue base of USD 168.928 billion. Assume workload growth of 20% and unchanged average realized revenue per unit of workload. Revenue becomes USD 202.714 billion, an increase of USD 33.786 billion. If that increment earns a 35% operating margin, incremental operating profit is USD 11.825 billion. Applying the assumed 25% tax rate gives USD 8.869 billion of after-tax operating contribution.
That contribution is not automatically incremental FCF. Holding working capital, depreciation-related cash adjustments and other businesses constant, incremental net cash capital spending of USD 15 billion would overwhelm the contribution by USD 6.131 billion. At USD 5 billion of incremental spending, the same simplified sensitivity leaves USD 3.869 billion. These are controlled analyst sensitivities, not company forecasts; the margin is an incremental assumption, distinct from the reported average AWS margin.
The valuation consequence follows directly. The favorable sensitivity produces incremental cash equal to only about 0.14% of the indicative equity capitalization. Larger value creation would need durable growth over several years, better investment efficiency, or additional commerce cash generation. The adverse sensitivity shows why rapid cloud revenue growth alone cannot settle the investment debate.
A second whole-company illustration assumes annual operating cash flow of USD 200 billion and net equipment spending of USD 160 billion. FCF would be USD 40 billion, or about a 1.43% yield. A stronger USD 220 billion cash-flow / USD 130 billion spending combination would produce USD 90 billion and a 3.21% yield. Both scenarios are assumptions; neither adjusts for acquisitions or lease principal. Their purpose is to expose the cash requirement embedded in the current capitalization.
The single most important forward variable is cash retained after the investment program relative to paid AWS workload expansion. Improvement in this relationship would strengthen the equity case more than another quarter of large investment valuation gains.
4. Industry and Competitive Landscape
The relevant industry boundary is enterprise cloud infrastructure and the software layers that generate demand for it. Agents and physical AI can increase the number of applications consuming compute and data services. They also introduce new costs, operational requirements and opportunities for customers to move between providers.
Cloud competition should be examined through deployment economics, customer relationships, data integration and workload portability. Faster model progress can create demand, but can also reduce the compute needed for a given task. The industry's economic outcome depends on whether application expansion outweighs efficiency gains and pricing pressure.
|
Competitive arena
|
Observable Amazon position
|
Competitors / substitutes
|
Implication
|
|
General cloud infrastructure
|
AWS quarterly revenue 42.232, USD billion
|
Microsoft Azure; Google Cloud; Oracle OCI
|
Large operating base; growth rates alone cannot establish share
|
|
Enterprise agents
|
Managed Agents preview described October 5
|
Azure ecosystems; Google enterprise AI; Oracle applications
|
Capture recurring compute and workflow usage; launch is not booked revenue
|
|
Physical AI
|
Physical AI Toolchain described October 8
|
NVIDIA ecosystem and other clouds
|
Potential training, simulation and storage demand; monetization unquantified
|
|
Commerce monetization
|
Advertising revenue 19.809, USD billion in Q2
|
Other retailers and digital advertising channels
|
Traffic economics can fund investment; no separate ad margin disclosed
|
|
Company / disclosed unit
|
Period ended
|
Revenue / KPI
|
Growth, YoY
|
Operating profitability / comparability
|
|
Amazon / AWS
|
June 30, 2026
|
USD 42.232 billion quarterly revenue
|
37%
|
USD 16.621 billion segment operating income; 39.4% margin
|
|
Microsoft / Azure and other cloud services
|
June 30, 2026
|
Azure annual revenue above USD 100 billion
|
43% quarterly
|
Intelligent Cloud revenue USD 39.306 billion includes other activities; not Azure revenue
|
|
Alphabet / Google Cloud
|
June 30, 2026
|
USD 24.768 billion quarterly revenue
|
82%
|
USD 8.814 billion segment operating income; 35.6% calculated margin
|
|
Oracle / OCI
|
August 31, 2026
|
USD 7.4 billion quarterly IaaS revenue
|
121%
|
No standalone OCI operating profit here; group GAAP operating income USD 6.7 billion
|
The comparison deliberately avoids an invented market-share denominator. AWS, Azure and other cloud services, Google Cloud and OCI have different boundaries. Google's segment includes Workspace and product revenue from TPU systems; Microsoft's Intelligent Cloud total is broader than Azure; Oracle's IaaS period ends two months later. Their reported growth rates cannot be ranked as if they measured identical consumption businesses.
Observable winners are Google Cloud and OCI on disclosed growth, with Azure also expanding rapidly; AWS remains a net beneficiary with substantial absolute operating profit. This is an assessment of reported operating momentum, not a claim that any provider has won the industry. AWS's absolute revenue base provides operating scale, while smaller competing bases can generate higher percentage growth.
The potential losers are suppliers that cannot fund competitive capacity, monetize customer adoption or differentiate beyond commodity compute. We do not label a named peer a loser merely because its growth rate is lower. None of the three disclosed peer examples shows revenue contraction in the relevant metric. Amazon's more specific vulnerability is that rivals can capture incremental demand fast enough to pressure its future pricing and investment returns even while AWS itself grows.
Agent platforms offer an economic route to retain customers by integrating applications with identity, permissions, data and deployment. The mechanism is operational convenience and recurring usage. The countervailing mechanism is portability: customers can distribute workloads or move components if switching becomes easier. Integration therefore supports a plausible advantage without guaranteeing a permanent premium margin.
Physical AI expands the potential workload set toward simulation, training and deployment of systems that act in the real world. Monetization can occur at several cloud-service layers, but adoption timelines may be long and uneven. We assign this development strategic relevance and zero separately modeled revenue until disclosure supports a financial estimate. It belongs in monitoring, not in a mechanical valuation uplift.
5. Key Risks
-
Capacity economics disappoint. If newly commissioned infrastructure remains underutilized or customers negotiate lower realized prices, depreciation and energy costs can absorb the incremental gross profit. Revenue growth could continue while cash returns deteriorate.
-
Capital intensity stays elevated. If equipment purchases keep outgrowing operating cash generation, negative FCF persists. Additional borrowing or a larger financing requirement would make the equity increasingly dependent on distant cash recovery and favorable capital-market access.
-
Customer concentration and financing linkages intensify. If major AI customers delay consumption or require additional funding, committed demand may translate into paid usage more slowly. Investors should examine investment relationships and cash collections rather than assume every announced commitment is independent cash demand.
-
Recurring profitability is misread. If investment gains reverse or simply stop, GAAP EPS can fall despite healthy operating profit. A valuation built on the current reported earnings multiple would then lose apparent support without a corresponding change in operating demand.
-
Commerce execution weakens. If shipping costs rise faster than unit economics or customer acquisition requires more promotion, regional profits can contract. That reduces the internal cash cushion available to support cloud investment.
-
Competitive pressure compresses returns. If Azure, Google Cloud or OCI wins incremental workloads through better performance or pricing, AWS may respond with discounts and accelerated investment. The combination can weaken margins and extend payback periods.
-
Product adoption takes longer than the narrative. If agent previews and physical AI initiatives remain experiments, associated paid workloads arrive later than investors expect. The financial consequence is delayed revenue against infrastructure costs already incurred.
-
Legal, tax and operational disruptions consume cash. An adverse tax settlement, material service outage or regulatory constraint can add cash expense or disrupt customer activity. These risks should be traced to actual disclosures rather than assigned unsupported loss estimates.
6. Monitoring Checklist
The thresholds below are analyst monitoring rules, not guidance or trading instructions.
-
AWS growth and margin together: growth above 30% with operating margin above 35% would support the operating thesis. Growth below 25% for two quarters, especially alongside margin below 35%, would weaken it.
-
Investment coverage: operating cash flow exceeding net equipment purchases over a TTM period would mark meaningful recovery. A continuing gap larger than USD 10 billion would preserve the cautious cash assessment.
-
Q3 delivery against July guidance: operating income above USD 26.5 billion would support upside to the disclosed range; below USD 22.5 billion would require a reassessment of operating execution and cost timing. No confirmed earnings date is assumed here.
-
Commerce profitability: North America margin above 7% and International above 3% would support continued internal funding. Falling below those levels would expose a second source of investment pressure.
-
Revenue recognition from new workflows: seek quantified paid usage, customer consumption and retention evidence for Managed Agents and physical AI. A launch count alone does not strengthen the cash forecast.
-
Financing and obligations: track changes in debt, lease commitments and liquidity together. Borrowing growth without better cash coverage would weaken capital-allocation confidence.
-
Earnings normalization: compare operating income, cash flow and investment-related other income each quarter. A lower GAAP EPS number accompanied by stronger retained cash could improve, rather than damage, the underlying investment case.
-
Valuation versus cash recovery: reassess the indicative capitalization against recurring profit and FCF. Sustainable FCF approaching USD 112 billion would meet the illustrative 4% cash-yield hurdle; materially less cash would leave valuation dependent on further growth.
7. Sources
-
AMZNON/USDT Spot Trading | LBank (https://www.lbank.com/trade/amznon_usdt) — Retrieved through command-line HTTP on October 13; pair, order-book section and buy/sell form present. No token quote is used as the equity close.
-
-
-
-
-
-
Amazon.com Announces Second Quarter Results (https://ir.aboutamazon.com/news-release/news-release-details/2026/Amazon-com-Announces-Second-Quarter-Results/default.aspx?mode=light) — July 30, 2026; quarter ended June 30; GAAP statements and company-defined FCF.
-
-
-
Amazon.com Announces Fourth Quarter Results (https://ir.aboutamazon.com/news-release/news-release-details/2026/Amazon-com-Announces-Fourth-Quarter-Results/default.aspx) — February 5, 2026; FY2025 history and cash-flow definitions.
-
-
-
Earnings Release FY26 Q4 (https://www.microsoft.com/en-us/investor/earnings/fy-2026-q4/press-release-webcast) — July 29, 2026; quarter ended June 30; Azure and group metrics separated.
-
-
-
Amazon Stock Price History (https://stockanalysis.com/stocks/amzn/history/) — Secondary market-data source; October 12 regular-session close USD 259.53; accessed October 13.
-