Author: LBank Research Analyst: Ludo
Disclaimer: This report is compiled and analyzed from publicly available information and is intended solely for information sharing and research discussion. It does not constitute investment advice, a securities recommendation, a trading instruction, or any guarantee of returns. The company operations, valuations, market prices, and consensus expectations discussed herein may change over time. Readers should independently verify the data and make their own decisions.
1. Core Conclusion
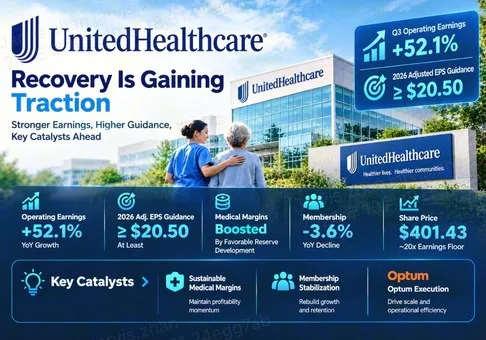
Overall judgment: UnitedHealth Group has a valuable integrated healthcare franchise and its cash recovery is credible. At USD 401.43, valuation is fair to full rather than clearly cheap; risk/reward leans cautious because roughly 20x the updated earnings floor already assumes that medical margins can remain repaired. The decisive variable is medical profitability after separating favorable reserve development from recurring claims performance.
-
A higher earnings floor supports the business case but leaves limited immediate valuation room. Management raised 2026 adjusted EPS guidance to at least USD 20.50 from USD 19.50–20.00. The October 16 stock close implies 19.6x that floor and 20.6x the GAAP floor of USD 19.50. These are guidance-floor multiples, not trailing P/E or consensus forecasts; actual multiples would be lower if earnings exceed the floor.
-
Medical margins improved, with a meaningful estimation contribution. Q3 MCR fell to 88.4% from 89.9%, while USD 610 million of favorable prior-period reserve development related to 2026 service dates helped the result. That amount is approximately 70 basis points of quarterly premium revenue. Removing it mechanically produces an MCR near 89.1%, still better than the prior year but less impressive than the headline.
-
Cash recovery is substantial and supports balance-sheet repair. Nine-month CFO of USD 25.087 billion less USD 2.421 billion of property, equipment and capitalized software purchases gives an analyst FCF proxy of USD 22.666 billion. This exceeds USD 11.201 billion of dividends and repurchases. The proxy is not freely distributable parent cash, but it supports the conclusion that the recovery is more than accounting presentation.
-
Profitability is recovering on a smaller membership base. UnitedHealthcare served 48.300 million medical members versus 50.125 million a year earlier, a 3.6% decline. Selective exits and pricing can improve underwriting, but repeated contraction eventually limits fixed-cost absorption and cross-selling. The next leg must demonstrate profitable retention, not merely the removal of weak contracts.
-
Optum is improving, but a uniform platform premium is premature. Optum Health generated USD 735 million operating earnings, while its adjusted operating earnings were USD 588 million. Optum Rx processed 393 million adjusted scripts versus 414 million a year earlier. The service businesses support diversification; the reported recovery still needs normalization and evidence of durable client demand.
Our explicit valuation sensitivity uses analyst assumptions, not a broker target. Applying 18x–20x to USD 20.50 produces USD 369–410, approximately 8.1% downside to 2.1% upside from the reference price, before distributions. A stronger scenario of USD 24.00 sustainable annual EPS at 20x gives USD 480, about 19.6% upside. A stress case of USD 18.00 at 16x gives USD 288, about 28.3% downside. The latter two EPS levels are scenarios, not published guidance. The current price is close to the upper end of our stabilization band, which explains the cautious conclusion despite improving operations.
The trading route covered here is UNHON/USDT spot, the Ondo tokenized-stock instrument. Search UNHON in LBank's spot market and use the verified link above. UNHON and NYSE-listed UNH are different instruments; the stock reference used for company valuation is USD 401.43, not a token quote. This report does not establish token redemption terms, direct shareholder rights or account-specific eligibility.
2. Company Overview, Business Mix, and Core Operating Metrics
UnitedHealth combines health insurance with care delivery, technology and pharmacy services. UnitedHealthcare collects premiums for risk-bearing plans and administration fees for service arrangements. Profit depends on aligning prices and benefit design with the cost of care. Optum sells services both inside and outside the group, giving the company multiple ways to participate in healthcare spending without making all revenue economically equivalent.
|
Business / Q3 2026
|
Revenue, USD billion
|
Operating earnings, USD billion
|
Business model and economic constraint
|
|
UnitedHealthcare
|
86.330
|
2.831
|
Employer, Medicare and Medicaid benefits; earns premiums and service fees; medical claims drive risk-bearing margins.
|
|
Optum Health
|
22.910
|
0.735
|
Care delivery and value-based arrangements; patient mix and local provider density determine unit economics.
|
|
Optum Insight
|
5.474
|
1.279
|
Technology, data, payment and administrative services; software and service efficiency support higher margins.
|
|
Optum Rx
|
39.927
|
1.718
|
Pharmacy benefits and pharmacy services; purchasing, mix and client pricing matter more than gross drug revenue alone.
|
Source basis: October 13 release, business and supplemental schedules. Figures are GAAP and rounded here to three decimals. UnitedHealthcare and Optum revenue cannot be added directly: corporate eliminations are USD 40.519 billion, while internal Optum eliminations are USD 1.428 billion. Optum's consolidated revenue is USD 66.883 billion and its operating earnings are USD 3.732 billion. Internal transfers should never be counted twice as independent demand.
Core operating metrics and changes
|
Operating test
|
Latest verified result
|
Investment implication
|
|
Revenue and profitability
|
Q3 revenue USD 112.694 billion, -0.4%; operating earnings USD 6.563 billion, +52.1%.
|
Recovery is margin-led; it is not a renewed volume growth cycle.
|
|
Medical care ratio (MCR)
|
88.4% versus 89.9% a year earlier and 86.7% in Q2.
|
Year-over-year repair is real, while seasonal sequential pressure remains.
|
|
Reserve contribution
|
USD 610 million favorable prior-period development related to 2026 service dates.
|
Distinguish current-year estimate revision from recurring current-quarter claims performance.
|
|
People served
|
UnitedHealthcare medical members: 48.300 million versus 50.125 million a year earlier.
|
Selective exits help pricing but reduce the volume base.
|
|
Outlook revision
|
2026 adjusted EPS at least USD 20.50; prior range USD 19.50–20.00.
|
A higher earnings floor is encouraging; it is not a guaranteed point forecast.
|
|
Cash and leverage
|
YTD CFO USD 25.087 billion; debt-to-capital 41.7%, versus 41.2% in Q2.
|
Cash funding improves; parent capital flexibility still needs monitoring.
|
Source basis: Q3 and Q2 2026 official earnings releases. Operating earnings use GAAP; adjusted EPS is non-GAAP. Medical membership differs from all consumers served by Optum. The debt-to-capital ratio follows the company's definition, which should not be replaced with a different denominator without reconciliation.
The operating question is whether intentional pruning improves the economics of the remaining book. A smaller high-quality portfolio can create more value than an expanding underpriced one. However, that thesis needs two observations together: adequate margins and a membership trajectory that eventually stabilizes. Revenue contraction should not automatically be classified as failure, nor should it be assumed to be entirely strategic.
Optum adds a separate test. Pharmacy revenue may be supported by drug mix even when script counts fall, and care-delivery revenue can decline as unprofitable geographies are exited. Investors should therefore follow service volumes and normalized contribution alongside revenue. The group's vertical integration creates opportunities for coordination, but it also complicates attribution of margins and exposes multiple businesses to the same patient-cost environment.
3. Fundamental Quality
|
Metric / USD billion except EPS
|
9M 2025
|
9M 2026
|
|
Revenue
|
334.352
|
336.447
|
|
GAAP operating earnings
|
18.584
|
23.544
|
|
GAAP operating margin, calculated
|
5.6%
|
7.0%
|
|
Common shareholder net earnings
|
12.046
|
15.874
|
|
GAAP diluted EPS, USD
|
13.21
|
17.50
|
|
Adjusted diluted EPS, USD
|
14.22
|
18.30
|
|
Cash flow from operations
|
18.589
|
25.087
|
|
Property, equipment and capitalized software purchases
|
2.674
|
2.421
|
|
CFO less those purchases, analyst FCF proxy
|
15.915
|
22.666
|
|
Cash and equivalents, period end
|
27.210
|
25.845
|
|
Cash and short-term investments, balance-sheet reference
|
28.121 at December 31, 2025
|
28.549 at September 30, 2026
|
|
Short- and long-term debt, balance-sheet reference
|
78.389 at December 31, 2025
|
74.331 at September 30, 2026
|
Source basis: unaudited Q3 release financial schedules. The first ten rows compare the nine months ended September 30 in each year. The last two rows explicitly compare September 2026 with December 2025 and are not September-to-September growth rates. The FCF proxy is our calculation, not a company-reported non-GAAP measure.
Fundamental quality is improving through cash generation and expense discipline, while recurring medical profitability remains the weaker link. Nine-month operating margin rose from approximately 5.6% to 7.0% on nearly flat revenue. That supports a repair thesis. It does not yet establish a return to a durable growth premium, because membership, reserve estimates and portfolio adjustments remain material.
The distinction between GAAP and adjusted earnings matters in both directions. Q3 GAAP operating earnings were USD 6.563 billion, while adjusted operating earnings were lower at USD 6.265 billion after portfolio and restructuring adjustments. At the EPS level, removing amortization and other items produces USD 4.69 adjusted versus USD 4.56 GAAP. Adjusted does not mean every benefit has been excluded, and the direction of the operating adjustment differs from the net EPS adjustment.
A reserve sensitivity makes the remaining uncertainty concrete. Using the quarter's reported tax expense divided by pretax earnings gives an approximate tax rate of 22.2%. Applying that rate to the USD 610 million favorable development and dividing by 902 million diluted shares gives about USD 0.53 per share. Subtracting this from adjusted EPS gives roughly USD 4.16. This is a diagnostic, not a restated result: it does not normalize all other items or claim that favorable development is improper. It measures how much of the quarter could depend on reassessing earlier claims.
Cash provides stronger support. The FCF proxy calculation is USD 25.087 billion minus USD 2.421 billion = USD 22.666 billion, compared with USD 15.915 billion a year earlier. Dividends of USD 6.170 billion and repurchases of USD 5.031 billion total USD 11.201 billion. Net borrowing cash flows show USD 3.075 billion of repayment. This combination is consistent with both shareholder returns and deleveraging, rather than distributions financed only through incremental debt.
However, insurance cash is not interchangeable with excess industrial-company cash. Claims obligations, statutory capital, regulated-subsidiary dividend limits and investment needs matter. The reported USD 4.327 billion favorable change in operating assets and liabilities also supports nine-month CFO and may not repeat. We do not subtract all cash and invested assets from debt and label the remainder unrestricted enterprise leverage.
Reproducible business-to-valuation transmission
Start with Q3 premium revenue of USD 87.078 billion and medical costs of USD 76.982 billion. Their ratio is approximately 88.4%. Holding premium volume, benefit mix and administrative expense constant, a 50-basis-point reduction in MCR adds USD 435.39 million of pretax operating earnings. Using the same approximate tax rate and diluted share count gives about USD 0.38 additional EPS for that quarter. A deterioration of the same size reverses the sign.
If that improvement persisted across four comparable quarters, the illustrative EPS effect would be around USD 1.50 annually and approximately USD 30 per share at an assumed 20x multiple. This is a controlled sensitivity, not a forecast: seasonality, premium repricing, member mix, minority interests and care-delivery interactions can change the outcome. Incremental after-tax profit can support operating cash over time, but claim payment timing and reserve funding prevent a one-for-one immediate cash conversion.
This chain identifies the single most important variable: sustainable medical margin after reserve-estimate effects. Revenue growth alone can be bought through inadequate pricing; accounting margin alone can be flattered by estimate revisions. A durable investment case requires premium adequacy, stable claims development and cash generation to agree. That is a higher hurdle than simply repeating a large year-over-year EPS percentage increase.
4. Industry and Competitive Landscape
The relevant competitors combine health benefits with pharmacy, clinical or administrative services in different proportions. They compete for employers, government-program members, provider relationships and service contracts. Medical inflation and utilization are shared pressures, but differing commercial, Medicare and Medicaid mixes mean an MCR comparison cannot by itself rank underwriting skill. Pharmacy revenue also includes substantial drug pass-through amounts, making consolidated revenue an unreliable proxy for economic market share.
|
Competitive arena
|
Evidence and scale
|
Who is winning / losing
|
Implication for UNH
|
|
Risk-bearing health benefits
|
UNH medical membership fell 3.6% year-over-year; MCR improved by 150 basis points.
|
UNH wins back profitability while losing membership scale.
|
Profitable retention must eventually replace repeated exits.
|
|
Integrated insurance recovery
|
CVS Q2 Health Care Benefits MBR 87.4%, down from 89.9%.
|
Aetna is also recovering; UNH has no monopoly on margin repair.
|
A premium requires a more durable operating outcome.
|
|
Employer health and services
|
Cigna Q2 Healthcare adjusted pre-tax margin 10.9%; group revenue +7%.
|
Cigna wins commercial earnings momentum; its MCR still rose.
|
Diversification helps, without removing medical inflation risk.
|
|
Health benefits and Carelon
|
Elevance Q2 adjusted EPS USD 7.45 includes about USD 0.80 net below-the-line benefit.
|
Reported earnings improve; recurring operating leadership remains unproven.
|
Compare normalized earnings, not headline beat size.
|
Source basis: company releases. These are directional competitive assessments, not measured changes in a common market-share denominator. A membership decline can coexist with better economics when pricing and contract selection improve.
|
Company / period
|
Revenue and growth
|
Earnings / medical-cost evidence
|
Comparability boundary
|
|
UnitedHealth Group Incorporated (UNH), Q3 2026
|
USD 112.694 billion; -0.4%.
|
Adjusted EPS USD 4.69; MCR 88.4%; 48.300 million medical members.
|
Integrated insurance and Optum; favorable reserve development included.
|
|
CVS Health Corporation (CVS), Q2 2026
|
USD 106.096 billion; +7.3%.
|
Adjusted EPS USD 2.58; Health Care Benefits MBR 87.4%.
|
Insurance, pharmacy services and retail; MBR applies to insurance segment.
|
|
The Cigna Group (CI), Q2 2026
|
USD 71.668 billion; about +7%.
|
Adjusted EPS USD 7.78; Cigna Healthcare MCR 84.5%.
|
Employer mix and Evernorth differ from UNH Medicare and Medicaid exposure.
|
|
Elevance Health, Inc. (ELV), Q2 2026
|
Operating revenue USD 49.8 billion; +0.8%.
|
Adjusted EPS USD 7.45; GAAP EPS USD 6.71.
|
Operating revenue differs from group total revenue; nonoperating benefit supports EPS.
|
Source basis: UNH Q3 2026; CVS, Cigna and Elevance Q2 2026. These are approximately comparable indicators, not synchronized quarter results. Adjusted definitions and cost-ratio denominators differ. No peer valuation ranking is asserted, and EPS levels should not be compared as though they measure company size or absolute stock attractiveness.
UNH is a net beneficiary of a more disciplined insurance book and a broad services platform, but it is currently a loser in membership scale. CVS's Aetna recovery shows that the margin repair is not exclusive to UNH. Cigna's employer business provides stronger operating momentum on a different risk mix, while its rising MCR shows that commercial diversification does not eliminate cost pressure. Elevance's disclosed below-the-line benefit is a reason to normalize its EPS before drawing a leadership conclusion.
The sector's strategic direction is toward clearer pricing and measurable service value. UNH's release commits to full pass-through of manufacturer drug rebate discounts to clients by January 2028 and discusses transparent fee-based pharmacy care. That direction can protect client trust while changing how economics are earned. It does not justify assuming that historical spread or rebate economics will survive unchanged. The attractive outcome is durable service income with stronger retention; the adverse outcome is lower pricing without enough operating savings.
At the current valuation, scale is a starting advantage rather than sufficient proof of pricing power. A defensible premium should emerge from better outcomes for clients, adequate underwriting and reliable cash remittance from subsidiaries. The evidence favors operational repair, while the stock already asks investors to underwrite a meaningful degree of durability.
5. Key Risks
-
Claims trend outruns pricing. If utilization or treatment cost rises faster than premium repricing, MCR can reverse quickly. The premium sensitivity above shows why modest percentage changes can materially reduce EPS and undermine a recovery multiple.
-
Favorable development proves temporary. If earlier-period estimates stop releasing or later deteriorate, apparent medical-margin improvement will lose support. A current-year reserve release should not be extrapolated as a recurring quarterly savings program.
-
Pruning turns into structural contraction. Continued losses in membership or pharmacy scripts would weaken distribution reach and fixed-cost absorption. If revenue shrinks faster than costs can be removed, better selected contracts may fail to improve group earnings.
-
Policy and oversight change the economics. Changes in government reimbursement, risk-adjustment enforcement, quality-based payments or pharmacy remuneration can affect revenue and compliance expense. The company's disclosed legal and regulatory exposure should be monitored without treating an unresolved allegation as a proven liability.
-
Cash cannot reach the parent when needed. Strong consolidated CFO may coexist with statutory capital needs, claim obligations or restricted subsidiary distributions. Excessive buybacks would reduce flexibility if the medical-cost cycle worsens.
-
Optum execution and systems disappoint. Care-delivery turnaround, transparent pharmacy pricing and administrative technology require reliable execution. Poor service, cyber disruption or failed cost savings could reduce client retention and create additional cash expense.
-
Valuation compresses despite earnings improvement. If investors demand a lower multiple for regulatory or reserve uncertainty, the share price may decline even with higher EPS. The stress sensitivity makes clear that a stronger reported quarter does not remove capital downside.
6. Monitoring Checklist
The following are analyst-defined tests, not company targets. They specify what would strengthen or weaken the fair-to-full valuation judgment.
-
MCR without unusually favorable development: track reported MCR and the reserve contribution separately. An estimate-neutral comparable-quarter MCR below 89.0% would strengthen the repair case; above 90.0% would weaken it. Treat seasonal differences explicitly.
-
Membership stabilization: a sequential decline under 0.5% while medical margins hold would support profitable retention. Continued losses above 1.0% per quarter would challenge the idea that exits are a finite repair step.
-
Optum Health quality: follow adjusted operating margin against the Q3 2.6% base. Sustained improvement above 3.0% without reliance on disposal gains would strengthen the platform case; renewed losses would invalidate it.
-
Optum Rx demand: compare adjusted scripts with the disclosed 393 million. Stabilization or renewed year-over-year growth with retained client economics would help; persistent contraction exceeding 5% would weaken the diversification argument.
-
Cash and leverage: require annual CFO to support capital purchases and distributions, while debt-to-capital moves toward the stated approximately 40.0% year-end objective. A ratio above 43.0% with buybacks continuing would signal weaker capital discipline.
-
Outlook and seasonality: compare the full-year outcome with at least USD 20.50 adjusted EPS. Nine-month adjusted EPS of USD 18.30 leaves approximately USD 2.20 to reach the floor, but this arithmetic is not a Q4 management forecast. A change in claims seasonality matters more than mechanically annualizing Q3.
-
Evidence required for a premium: a sustained valuation above 22x earnings without better normalized MCR, retention and Optum margins would make risk/reward less attractive. Conversely, a lower multiple alongside stable cash and claims development would improve the valuation cushion.
7. Sources
Research cutoff: October 19, 2026, Asia/Shanghai. The equity reference is the October 16 NYSE regular-session close, USD 401.43, cross-checked across two secondary market sources. All operating conclusions use public company or SEC materials; no proprietary consensus, broker rating or management price target is asserted.
Universe verification preceded selection. UNHON, IBMON and AMDON spot interfaces were discovered through official LBank listing links, followed through canonical redirects and opened on October 19. Each showed an instrument name, nonzero price, daily range and USDT turnover alongside trading controls. The official UNHON listing identifies UnitedHealth Group Incorporated explicitly. Dedicated delisting searches did not surface a matching UNHON notice; absence from search is not relied on as proof of availability. The populated trading page and archived current HTTP capture are the affirmative evidence. Historical futures shells with placeholder quotes were excluded. Search UNHON under Spot, not the retired PEP contract or the underlying NYSE ticker alone.
UNH had no valid coverage record in the preceding 90 days. The selection trigger is the October 13 earnings release. This issue replaces the withdrawn PEP selection; the withdrawn files and audit records remain marked as such.
-
UnitedHealth Group Reports Third Quarter 2026 Results (https://www.unitedhealthgroup.com/content/dam/UHG/PDF/investors/2026/unh-reports-third-quarter-2026-results.pdf) — 2026-10-13; 16-page release, unaudited Q3 and nine-month accounts; downloaded and text-checked.
-
-
-
-
UnitedHealth Group Form 10-Q for June 30, 2026 (https://www.sec.gov/Archives/edgar/data/731766/000073176626000197/unh-20260630.htm) — Q2 interim filing identified on EDGAR; direct local fetch blocked. Q3 accounts in this report use the verified October 13 release, not a claimed Q3 Form 10-Q.
-
-
-
-
UnitedHealth Group Stock Price History (https://stockanalysis.com/stocks/unh/history/) — Secondary market source; October 16, 2026 regular-session close USD 401.43. No consensus estimates used.
-
-
-
UNHON/USDT Spot Trading | LBank (https://www.lbank.com/trade/unhon_usdt) — Opened via official announcement and canonical redirect on 2026-10-19; nonzero price, daily high/low, USDT turnover and buy/sell interface.
-
-
IBMON/USDT Spot Trading | LBank (https://www.lbank.com/trade/ibmon_usdt) — Opened 2026-10-19 before selection; price, daily range and nonzero turnover visible.
-
-
AMDON/USDT Spot Trading | LBank (https://www.lbank.com/trade/amdon_usdt) — Opened 2026-10-19 before selection; price, daily range and nonzero turnover visible.



 Paglipat