Author: LBank Research Analyst: Steven.fu
Trading Pairs:
Disclaimer: This report is based on publicly available information and analysis and is intended solely for informational and research discussion purposes. It does not constitute investment advice, a securities recommendation, a trading instruction, or any guarantee of returns. Company operations, valuations, market prices, and consensus expectations discussed herein may change over time. Readers should independently verify the data and make their own decisions.
This issue reviews eleven technology companies that released their latest results after the US market closed on August 5: Sandisk (SNDK), Western Digital (WDC), AppLovin (APP), MercadoLibre (MELI), DoorDash (DASH), Block (XYZ), Axon Enterprise (AXON), Figma (FIG), HubSpot (HUBS), IonQ (IONQ), and SiTime (SITM). Sandisk and Western Digital reported FY2026 Q4 for the period ended July 3, while the other companies reported calendar Q2. Because the companies span unrelated industries, this report does not rank them against one another. It analyzes each company's operating changes, cash quality, post-earnings valuation, and stock risk-reward rating independently.
1. Key Conclusions: Growth Remains Broadly Strong, but Valuations Now Demand Cash-Flow Delivery
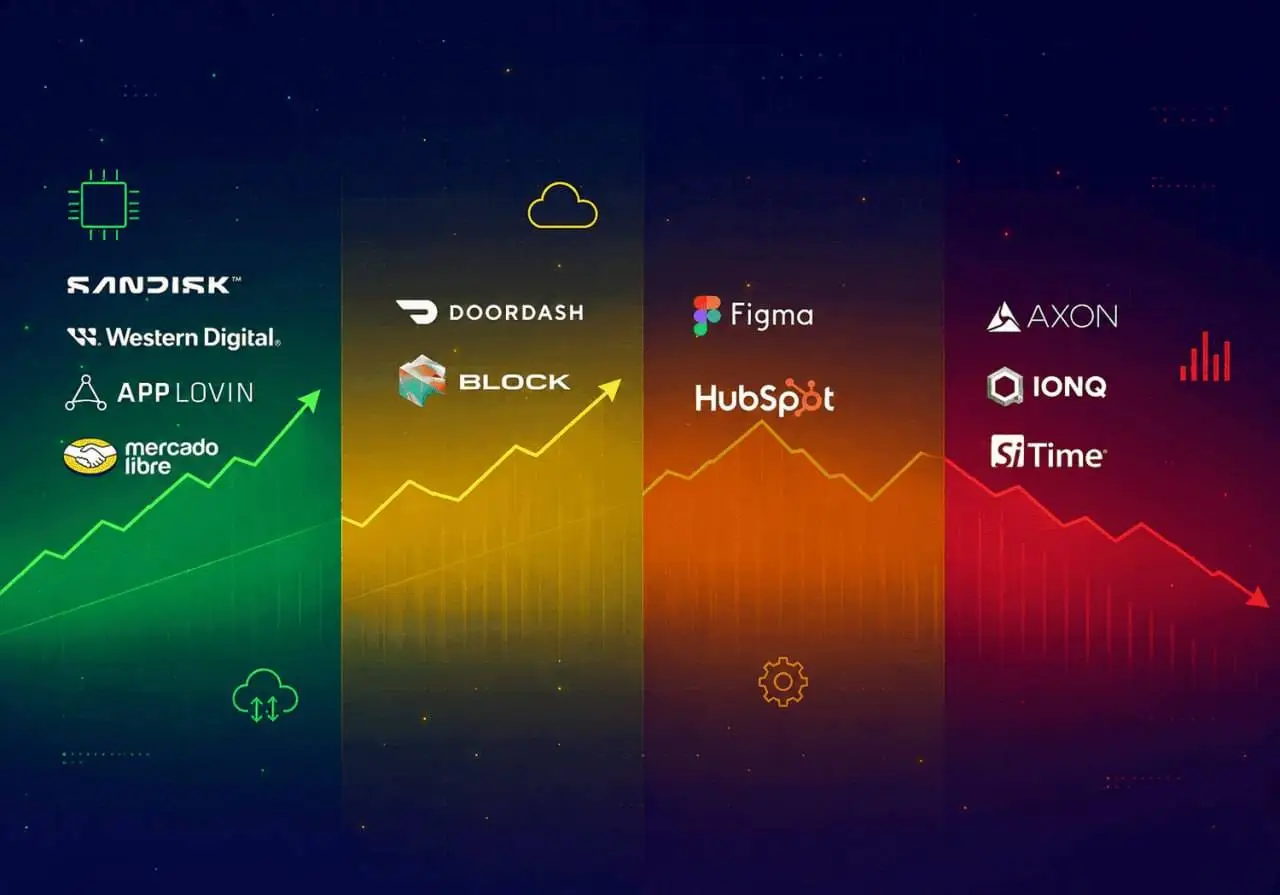
Overall view: Last night's earnings confirmed strong demand across AI data storage, advertising algorithms, local commerce, fintech, public-safety software, collaborative design, and quantum computing. Yet share prices no longer reward revenue growth alone. On stock risk-reward, Sandisk, Block, and HubSpot are positive; AppLovin and DoorDash are neutral-positive; Western Digital, MercadoLibre, and Figma are neutral-negative; and Axon, IonQ, and SiTime are negative. The primary variable is whether high growth can convert into sustainable free cash flow per share after stock-based compensation, acquisition investment, customer prepayments, and working-capital effects.
-
The storage cycle produced far greater earnings leverage than revenue leverage, but Sandisk and Western Digital have opposite stock conclusions. Sandisk reported quarterly revenue of $8.965B, a GAAP gross margin of 84.6%, adjusted FCF of $5.035B, and a $45 midpoint for FY2027 Q1 non-GAAP EPS guidance. The $1,243 final after-hours price was only about 6.9x that quarterly EPS midpoint on a simple annualized basis, supporting a positive rating. Western Digital also delivered excellent results, with Q4 revenue growth of 44% and FCF of $1.281B. However, its approximately $158B implied after-hours market capitalization equaled about 12.2x FY2026 revenue, while its FY2026 FCF yield was only 2.2%. Its rating is neutral-negative.
-
The software and advertising-platform re-rating has started to distinguish high GAAP profits from high adjusted profits. AppLovin generated a Q2 GAAP operating margin of approximately 77.7% and FCF of $863M. After a 15.75% after-hours decline, the stock traded at about 23.4x simply annualized Q2 GAAP EPS, improving risk-reward to neutral-positive. After falling 20.07% after hours, HubSpot traded at about 2.8x FY2026 revenue and 15.1x FY2026 non-GAAP EPS, with a mechanically annualized Q2 FCF yield of approximately 6.6%; its rating is positive. Figma grew revenue 48% and reached 136% NDR, but quarterly stock-based compensation equaled roughly 40% of revenue and its mechanically annualized FCF yield was only about 1.7%. Its rating remains neutral-negative.
-
Consumer and fintech platforms all posted strong growth, but cash conversion determines the ratings. Block grew gross profit 25% and generated Q2 FCF of $967M. Its after-hours price equaled about 20.7x full-year adjusted EPS guidance, while its mechanically annualized Q2 FCF yield was approximately 7.8%; the rating is positive. DoorDash still grew revenue 24% excluding Deliveroo and increased FCF 109%, but stock-based compensation and merchant-settlement timing limit the rating to neutral-positive. MercadoLibre grew revenue 50%, GMV 44%, and TPV 56%, yet first-half adjusted FCF declined from $512M to $158M and net debt increased to $6.425B. At roughly 50x simply annualized Q2 EPS, the stock remains expensive.
-
Axon, IonQ, and SiTime all delivered high growth, but their stock risk exceeds their operating risk. Axon grew revenue 35%, ARR 39%, and future contracted bookings 41%, but Q2 FCF was negative $1M and full-year stock-based compensation guidance was $590M-$620M. IonQ grew revenue 287%, while its adjusted EBITDA loss remained $120M. SiTime grew revenue 127%, but after a 34.22% after-hours gain it traded at about 34.7x annualized Q2 revenue and 77.9x simply annualized non-GAAP EPS. Their products and orders may continue to grow, but current valuations allow almost no room for execution errors.
-
After-hours reactions are evidence of expectation resets, not proof of fundamental causation. HubSpot, AppLovin, Figma, Western Digital, and Sandisk declined approximately 20.07%, 15.75%, 15.31%, 11.73%, and 7.96%, respectively, while SiTime gained approximately 34.22%. This report consistently uses the August 5 regular close and the final available extended-hours price before 20:00 ET. The variables that matter are next-quarter revenue, margin, and cash-flow thresholds; a single evening's price move should not be treated as a direct verdict on earnings quality.
2. Eleven Company Reviews: Similar Growth, Very Different Costs of Delivery
Sandisk: Data-Center Demand and Pricing Converge, While Prepayments Inflate Peak FCF
Earnings performance. FY2026 Q4 revenue reached $8.965B, up 372% year over year and 51% sequentially. Approximately one-third of the sequential increase came from volume and two-thirds from pricing. Data Center revenue doubled sequentially to $2.977B, while Edge revenue rose 48% sequentially to $5.432B. GAAP gross margin increased from 78.4% in the prior quarter to 84.6%, GAAP net income reached $6.903B, and non-GAAP EPS was $39.25. The combined effect of revenue, mix, and pricing shows that AI storage demand has moved directly into the income statement rather than remaining only an order narrative.
Cash flow and valuation. Q4 operating cash flow was $7.126B and FCF was $7.083B. After excluding Flash Ventures activity and NBM prepayments and deposits, adjusted FCF was $5.035B. FY2026 adjusted FCF was $8.743B. The company held $4.762B of cash, had no long-term debt at period-end, and increased its remaining repurchase authorization to $15.5B. FY2027 Q1 guidance calls for revenue of $10.3B-$10.8B and non-GAAP EPS of $44-$46. The final after-hours price was $1,243, down 7.96% from the close, implying a market capitalization of approximately $184.1B. That equals about 6.9x the simply annualized EPS guidance midpoint, while the FY2026 adjusted FCF yield is approximately 4.7%.
Research rating: Positive. The valuation offers some buffer against NAND pricing normalization, but customer prepayments should not be treated as permanent profit. The rating should be reduced if Q1 revenue falls below $10.3B, gross margin drops below 80%, or quarterly adjusted FCF excluding NBM falls below $3.5B. The positive view would be reinforced if Data Center revenue continues to grow more than 30% sequentially and adjusted FCF remains above $4B.
Western Digital: Record HDD Margins, but 12x Annual Revenue Lacks a Cycle Margin of Safety
Earnings performance. FY2026 Q4 revenue was $3.747B, up 44% year over year and 12% sequentially. GAAP gross margin was 54.1% and operating margin was 41.7%, up 13.1 and 15.6 percentage points year over year, respectively. Non-GAAP EPS rose 109% to $3.56. Operating cash flow was $1.389B and FCF was $1.281B. FY2026 revenue reached $12.919B and FCF was $3.511B, showing that HDD pricing and cloud-capacity demand have converted the cycle upswing into cash.
Guidance and valuation. The midpoint of FY2027 Q1 revenue guidance is $4.1B, implying approximately 45% year-over-year growth. The non-GAAP gross-margin midpoint is 55.5% and the EPS midpoint is $4.00, indicating further profit expansion. The final after-hours price was $458.28, down 11.73% from the close, implying a market capitalization of approximately $158B. That equals about 12.2x FY2026 revenue and 28.6x simply annualized Q1 EPS, while the FY2026 FCF yield is approximately 2.2%. For an HDD company still exposed to capacity demand, pricing, and cloud-customer purchasing cycles, this valuation requires the current margin level to persist for years.
Research rating: Neutral-negative. The operating direction is correct, but the stock has little tolerance for error. Q1 revenue above $4.2B, gross margin above 56%, and quarterly FCF above $1.5B would ease the valuation pressure. If cloud nearline demand slows, gross margin falls below 50%, or FCF drops below $1B, the risk of multiple compression would increase.
AppLovin: 53% Growth and a 78% GAAP Operating Margin, With the After-Hours Pullback Improving Risk-Reward
Earnings performance. Q2 revenue was $1.924B, up 53% year over year. GAAP operating income was $1.494B, equal to an operating margin of approximately 77.7%. Net income reached $1.267B and diluted EPS was $3.76. Operating cash flow was $869M and FCF was $863M. The company repurchased and withheld 1.1M shares for $551M, ending the quarter with approximately 335M shares outstanding. The advertising platform's algorithmic efficiency and asset-light structure continue to increase revenue and profit simultaneously.
Guidance and valuation. Q3 revenue guidance is $2.055B-$2.085B, with the midpoint implying another 7.6% sequential increase. Adjusted EBITDA guidance is $1.710B-$1.740B at an 83% margin. The final after-hours price was $352, down 15.75% from the close, implying a market capitalization of approximately $118.3B. That equals about 23.4x simply annualized Q2 GAAP EPS, while the mechanically annualized Q2 FCF yield is approximately 2.9%. The earnings multiple has entered a debatable range, but approximately 15.4x annualized Q2 revenue still shows that the market is capitalizing high margins far into the future.
Research rating: Neutral-positive. The pullback has made the operating thresholds required for upside more attainable. The rating would strengthen if Q3 revenue exceeds $2.085B, GAAP operating margin remains above 75%, and FCF exceeds $900M. If advertising-customer concentration, platform policy, or regulatory changes push revenue below $2.055B, or if the FCF yield remains below 3%, the valuation could still fall further.
MercadoLibre: The Ecosystem Flywheel Accelerates, but Profit and Cash Give Way to Growth
Earnings performance. Q2 net revenue and financial income reached $10.169B, up 49.8% year over year and 42.9% on a currency-neutral basis. GMV was $21.9B, up 44%, while TPV was $101.0B, up 56%. Unique Commerce buyers increased 26%, Fintech monthly active users grew 30% to 88M, and MELI+ subscribers increased 72%. Advertising revenue grew 62% on a currency-neutral basis and, by the company's measurement, exceeded a 10% share of Latin America's digital advertising market for the first time. The key marker of growth quality is the 37% increase in ecosystem users: their GMV per user is 70% higher than that of commerce-only users, while their TPV per user is nearly 90% higher than that of fintech-only users.
Profit, credit, and cash flow. Operating income declined 17% to $683M, while operating margin fell from 12.2% to 6.7%. Net income was $466M and diluted EPS was $9.19. The credit portfolio exceeded $16B, up 75%. The overall 15-90 day nonperforming-loan ratio was 7.0% and the credit-card ratio was 4.6%, but credit-card net interest margin after losses was negative 2.5%, showing that customer acquisition diluted profitability. First-half operating cash flow was $5.737B, but adjusted FCF was only $158M, down from $512M a year earlier. Net debt increased from $4.682B at year-end 2025 to $6.425B.
Research rating: Neutral-negative. The final after-hours price was $1,836, down 4.50% from the close, implying a market capitalization of approximately $93.1B. That equals about 50x simply annualized Q2 EPS, while the simply annualized first-half adjusted FCF yield is only approximately 0.34%. If operating margin recovers above 9%, credit-card net interest margin after losses turns positive, and six-month adjusted FCF exceeds $1B, cash generation could support the valuation again. If credit continues to expand while operating margin remains below 7%, high growth will require even more funding.
DoorDash: Deliveroo Expands Scale, While the Core Business and FCF Still Grow Together
Earnings performance. Q2 orders reached 970M, up 27% year over year. Marketplace GOV was $33.078B, up 36%, and revenue was $4.454B, also up 36%. Excluding Deliveroo, orders, GOV, and revenue still grew 17%, 23%, and 24%, respectively, showing that the acquisition was not the only source of growth. GAAP net income declined 30% to $200M, while adjusted EBITDA rose 40% to $914M. Operating cash flow was $944M and FCF increased 109% to $742M.
Guidance and valuation. Q3 Marketplace GOV guidance is $33B-$34B, while adjusted EBITDA guidance is $950M-$1.10B. The company expects FY2026 stock-based compensation of $1.2B-$1.3B and estimates that year-end merchant-payment timing will reduce reported-period FCF by $700M-$800M. These two items are essential to understanding cash conversion. The final after-hours price was $210, up 1.32% from the close, implying a market capitalization of approximately $91.5B. That equals about 25x simply annualized Q2 EBITDA, while the mechanically annualized Q2 FCF yield is 3.2%.
Research rating: Neutral-positive. The core business, international operations, and cash flow are all growing, but the valuation still requires a smooth integration. Q3 GOV above $34B, adjusted EBITDA above $1.05B, and continued FCF growth after normalizing merchant-settlement timing would strengthen the rating. If Deliveroo integration raises the expense ratio or core revenue growth falls below 20%, the positive bias should be reduced.
Block: Cash App and Square Accelerate Together, and the Cash Yield Finally Matches Growth
Earnings performance. Q2 gross profit reached $3.17B, up 25% year over year. Cash App gross profit was $1.97B, up 31%, while Square gross profit was $1.16B, up 13%. Revenue was $6.618B, up approximately 9%. GAAP operating income was $447M, and adjusted operating income was $864M, equal to 27% of gross profit. Adjusted EPS rose 65% to $1.02. Square US GPV grew 10%, its fastest pace since Q2 2023. Cash App Commerce Enablement volume increased 17% to $56.5B, while consumer-loan originations rose 59% to $18.9B.
Cash flow and guidance. Q2 FCF was approximately $967M. The company raised FY2026 gross-profit guidance to $12.51B, representing 21% growth; adjusted operating-income guidance to $3.47B at a 28% margin; and adjusted EPS guidance to $4.02. The final after-hours price was $83.07, down 1.34% from the close, implying a market capitalization of approximately $49.5B. That equals about 20.7x full-year adjusted EPS guidance, while the mechanically annualized Q2 FCF yield is approximately 7.8%.
Research rating: Positive. Block now offers growth, margin expansion, and cash returns at the same time, while its valuation provides more buffer than those of comparable platforms. The positive view would continue if Q3 gross profit meets the $3.13B guidance, adjusted operating margin remains at 28%, and quarterly FCF exceeds $800M. The rating should move to neutral if consumer-loan loss rates rise materially, Cash App gross-profit growth falls below 20%, or FCF drops below $500M.
Axon Enterprise: Orders and ARR Keep Winning, but Zero FCF Exposes the Cost of the Valuation
Earnings performance. Q2 revenue reached $904M, up 35% year over year. Software and Services revenue was $398M, up 36%, while Connected Devices revenue was $507M, up 35%. ARR increased 39% to $1.639B, NRR rose to 126%, and future contracted bookings increased 41% to $15.1B. The company expects to recognize 20%-25% of those future contracted bookings over the next twelve months. Cross-selling across software, devices, drones, and 911 systems continues to validate the platform strategy.
Profit, cash flow, and valuation. GAAP net income was $29M, equal to a 3.3% net margin. Adjusted EBITDA was $242M at a 26.8% margin. Operating cash flow was $20M, FCF was negative $1M, and net debt was $1.1B. The company raised FY2026 revenue-growth guidance from 30%-32% to 32%-34% and maintained a 25.5% adjusted EBITDA margin outlook, but full-year stock-based compensation is expected to reach $590M-$620M. The final after-hours price was $588, down 3.53% from the close, implying a market capitalization of approximately $47.4B. That equals 13.1x simply annualized Q2 revenue and approximately 49x simply annualized adjusted EBITDA.
Research rating: Negative. The company is high quality, but the stock still prepays years of high growth. Risk-reward would improve if quarterly FCF rises above $100M, stock-based compensation falls below 12% of revenue, and software gross margin returns above 75%. If inventory and receivables continue to consume cash, order growth alone cannot support the current valuation.
Figma: AI Credits Begin to Monetize, While Stock-Based Compensation Equal to 40% of Revenue Still Dilutes Cash Quality
Earnings performance. Q2 revenue reached $370M, up 48% year over year and accelerating for a third consecutive quarter. GAAP gross margin was 84% and NDR was 136%. The number of customers with more than $10,000 of ARR increased 34% to 15,964, while customers with more than $100,000 of ARR grew 46% to 1,635. More than 80% of customers with over $10,000 of ARR consume AI credits every week. By placing design, code, and agents on the same canvas, Figma has moved AI-credit consumption from a usage metric into a revenue metric.
Profit and valuation. GAAP operating loss was $117M, equal to a negative 32% margin, while non-GAAP operating income was $36.1M at a 10% margin. Quarterly stock-based compensation was $148M, or approximately 39.9% of revenue. Operating cash flow was $60.9M and FCF was $53.2M. FY2026 revenue guidance was raised by $40M to $1.463B-$1.467B, representing 39% growth, but the non-GAAP operating-margin midpoint is only 9%. The final after-hours price was $23.84, down 15.31%, implying a market capitalization of approximately $12.6B. That equals about 8.6x full-year revenue, while the mechanically annualized Q2 FCF yield is approximately 1.7%.
Research rating: Neutral-negative. The growth and NDR are impressive, but the valuation does not yet fully absorb the GAAP dilution cost. The rating could be raised if stock-based compensation falls below 30% of revenue, FCF margin exceeds 20%, and Q3 revenue surpasses $375M. If revenue growth slows to 36% as guided while adjusted operating margin remains in the single digits, the current sales multiple will still be high.
HubSpot: Growth Steps Down, but a 20% After-Hours Drop Brings Cash Flow Back Into the Valuation
Earnings performance. Q2 revenue was $912M, up 20% year over year and 17% on a constant-currency basis. Subscription revenue was $894M, up 20%. GAAP operating income was $43.3M at a 4.8% margin, compared with a negative 3.2% margin a year earlier. Non-GAAP operating income was $185M at a 20.3% margin. Operating cash flow was $223M and non-GAAP FCF was $168M. Customer count grew 14% to 306,446, average subscription revenue per customer increased 4% to $11,800, and calculated billings grew 14%. The company repurchased $532M of shares in Q2 and authorized a new $1B repurchase program.
Guidance and valuation. Q3 revenue guidance is $924M-$925M, representing 14% year-over-year growth and a material slowdown from Q2. FY2026 revenue guidance is $3.678B-$3.686B, up 18%, with non-GAAP EPS of $13.23-$13.31. The final after-hours price was $200, down 20.07% from the close, implying a market capitalization of approximately $10.2B. That equals about 2.8x full-year revenue and 15.1x the full-year EPS guidance midpoint, while the mechanically annualized Q2 FCF yield is approximately 6.6%.
Research rating: Positive. The AI pricing transition is slowing reported growth, but the valuation now provides a visible cash buffer. The positive view holds if Q3 revenue reaches the high end of guidance, non-GAAP operating margin remains at 20%, and customer growth stays at or above 12%. The rating should move to neutral if calculated-billings growth falls below 10%, average subscription revenue per customer turns negative, or repurchases fail to offset stock-based compensation.
IonQ: Revenue Grows 287%, but 47x Annualized Sales Still Ignores Acquisitions and Losses
Earnings performance. Q2 revenue reached $80.05M, up 287% year over year and 20% above the midpoint of the original guidance. Approximately 50% of revenue came from international markets, 60% from commercial customers, and 25% from multi-product engagements, reducing reliance on a single government contract. RPO increased 297% year over year. The company raised FY2026 revenue guidance to $280M-$290M and continues to expect 100% organic revenue growth. This guidance does not yet include the SkyWater acquisition completed on July 31.
Losses, cash, and valuation. The Q2 adjusted EBITDA loss was $120M. Excluding the quarter's SkyWater commercial-collaboration spending, the loss was still $95.6M. GAAP net loss was $1.868B and adjusted EPS was negative $0.33. Cash and investments totaled $3B at quarter-end and would be approximately $2B on a pro forma basis after completing SkyWater. The final after-hours price was $40.39, up 1.15% from the close, implying a market capitalization of approximately $15.1B. That equals 47.1x simply annualized Q2 revenue.
Research rating: Negative. Commercialization has reached a breakthrough, but the capital market has prepaid a success probability far beyond the current revenue base. Risk-reward would improve only if quarterly organic revenue excluding SkyWater exceeds $100M, the adjusted EBITDA loss narrows below $70M, and RPO maintains triple-digit growth. If acquisitions rapidly reduce the cash balance or revenue recognition depends on a small number of large projects, valuation downside remains substantial.
SiTime: Precision Timing Reaches a Profit Inflection, but a 34% After-Hours Gain Prepays Acquisition Synergies
Earnings performance. Q2 revenue reached $157M, up 127% year over year and 39% sequentially. Every business grew at least 50%, while CED increased 181%. GAAP gross margin was 63.0%, operating income was $8.21M, net income was $18.16M, and diluted EPS was $0.66. Non-GAAP gross margin was 67.1%, operating income was $53.46M at a 34% margin, and non-GAAP EPS was $2.34. The company completed its acquisition of the Renesas Timing Business on July 1, adding more than 550 clocking products and expanding from MEMS oscillators into a more complete precision-timing platform.
Valuation and capital structure. Cash and short-term investments totaled $1.921B at quarter-end, including net convertible-debt proceeds used for the acquisition, so the full amount should not be treated as residual net cash. The final after-hours price was $729, up 34.22% from the close, implying a market capitalization of approximately $21.8B. That equals 34.7x simply annualized Q2 revenue and approximately 77.9x simply annualized non-GAAP EPS. The earnings release did not provide quantified next-quarter guidance, yet the market has already capitalized product expansion and synergies.
Research rating: Negative. The profit inflection is real, but the share-price increase has already embedded successful integration in the base case. The current valuation would gain stronger support if post-acquisition quarterly revenue exceeds $250M, non-GAAP gross margin remains above 65%, and GAAP operating margin rises above 15%. If acquisition amortization, financing costs, or customer inventory correction pushes gross margin below 60%, the high multiple could compress quickly.
3. Principal Risks
-
Storage pricing and customer prepayments could reverse. Sandisk and Western Digital margins both depend on supply and demand, ASPs, and cloud-customer purchasing cadence. NBM prepayments increased Sandisk's reported-period cash flow. If pricing momentum ends or customers reduce prepayments, profit and FCF could decline together.
-
High valuations remain sensitive even to moderate slowdowns. AppLovin, Axon, Figma, IonQ, and SiTime still trade at high sales or earnings multiples after their after-hours re-ratings. Merely meeting revenue guidance, a 1-2 percentage-point decline in gross margin, or an end to guidance raises could trigger multiple compression larger than the earnings change itself.
-
Stock-based compensation dilutes true per-share returns. Figma's Q2 stock-based compensation equaled approximately 40% of revenue, Axon's full-year guidance approaches $600M, and DoorDash and HubSpot must also sustain repurchases to offset dilution. If FCF is generated largely by shifting compensation into equity, an increase in corporate cash does not translate into an equal increase in value per share.
-
Credit and funding costs could rise. MercadoLibre's credit portfolio exceeds $16B, while Block's consumer-loan originations are growing rapidly. Higher nonperforming-loan ratios, funding costs, or regulatory capital requirements would flow through first to provisions, net margins, and free cash flow.
-
Acquisition and integration risk is material. DoorDash is integrating Deliveroo, IonQ has completed the SkyWater and Nexus transactions, and SiTime has acquired the Renesas Timing Business. Acquisitions can increase revenue, but they also bring amortization, debt, integration costs, and customer attrition. Consolidated growth that is not disaggregated should not automatically be treated as organic growth.
-
Platform policy and regulation can affect multiple business models. AppLovin depends on the mobile advertising ecosystem, DoorDash faces labor and delivery regulation, Block operates across payments, lending, stablecoins, and banking, and Axon is exposed to government procurement, privacy, and public-safety rules. Policy changes could affect revenue availability, costs, and valuation discounts at the same time.
-
After-hours prices and reporting definitions have limitations. Extended-hours prices may be affected by low liquidity. Implied market capitalizations are mechanically estimated as Nasdaq closing market capitalization multiplied by the after-hours price and divided by the regular closing price. Non-GAAP definitions differ across companies. This report does not force Nasdaq calendar EPS forecasts into company-adjusted reporting definitions, nor does it use that dataset to construct mechanical beat-or-miss comparisons.
4. Monitoring Checklist
-
Sandisk: Can FY2027 Q1 revenue exceed $10.3B, can gross margin remain above 80%, and can adjusted FCF excluding NBM stay above $3.5B? Failure on any item would weaken the positive rating.
-
Western Digital: Can Q1 revenue reach $4.1B, non-GAAP gross margin reach 55.5%, and quarterly FCF exceed $1.5B? FCF below $1B would reinforce the negative bias.
-
AppLovin: Does Q3 revenue exceed $2.085B, does GAAP operating margin remain at or above 75%, and does quarterly FCF exceed $900M?
-
MercadoLibre: Can operating margin recover above 9%, can credit-card net interest margin after losses turn positive, can the overall 15-90 day nonperforming-loan ratio stay at or below 7%, and can six-month adjusted FCF exceed $1B?
-
DoorDash: Can Q3 GOV and adjusted EBITDA reach $34B and $1.05B, respectively, can revenue growth excluding Deliveroo stay above 20%, and does FCF still grow after adjusting for merchant-payment timing?
-
Block: Can Q3 gross profit reach $3.13B, can adjusted operating margin remain at 28%, can Cash App and Square gross-profit growth stay above 25% and 10%, respectively, and can quarterly FCF exceed $800M?
-
Axon: Can quarterly FCF turn positive and exceed $100M, can software gross margin recover above 75%, can stock-based compensation fall below 12% of revenue, and do future contracted bookings convert into revenue in line with the 20%-25% twelve-month recognition cadence?
-
Figma: Can Q3 revenue exceed $375M, can NDR remain above 130%, can stock-based compensation fall below 30% of revenue, and can FCF margin rise to 20%?
-
HubSpot: Can Q3 revenue reach the high end of guidance, can calculated-billings growth remain above 12%, can customer growth stay at or above 12%, and can non-GAAP FCF margin remain above 18%?
-
IonQ: Can quarterly organic revenue excluding SkyWater exceed $100M, can the adjusted EBITDA loss narrow below $70M, and can pro forma cash remain above $1.8B?
-
SiTime: Can quarterly revenue after consolidating the Renesas Timing Business exceed $250M, can non-GAAP gross margin remain above 65%, can GAAP operating margin rise to 15%, and can the per-share impact of convertible debt and acquisition amortization remain manageable?
5. Sources