
What the Bull Flag Pattern Actually Tells You
A Bull Flag is a bullish continuation pattern that shows up during an uptrend. It tells traders that the current pause in buying is likely temporary and that the price will probably keep rising. You can think of it as the market catching its breath before resuming its climb.
The pattern gets its name because it looks like a flag flying from a pole on a chart. The pattern has three parts. The first is the flagpole, which is a sharp and fast rise in price caused by heavy buying pressure or a major catalyst such as a news event, earnings surprise, or exchange listing. The second is the flag itself, a short period of consolidation where the price drifts slightly downward inside a small parallel channel. The third part is the breakout, where the price breaks above the top edge of the flag and continues rising. This breakout is usually confirmed by a surge in buying volume.
For advanced traders, the Bull Flag is one of the most actionable continuation setups in technical analysis. But its value goes beyond just pattern recognition. It also gives you a structured framework for setting entry points, stop-losses, and price targets. That said, the pattern only works well when it is confirmed by volume, momentum indicators, and the broader market context.
The Psychology Behind the Bull Flag
Every chart pattern reflects human behavior, and the Bull Flag is no different. After a sharp price rise, a group of short-term sellers steps in. These are often profit-takers who bought earlier in the move and are now locking in gains. Their selling creates a slow, downward drift in price, which forms the flag portion of the pattern.
But here is the key detail. The selling during this phase is weak. Volume drops significantly compared to the flagpole, which shows that there is not enough conviction to reverse the trend. At the same time, buyers are still sitting at lower price levels, waiting for the right moment to re-enter and push prices higher.
This is where many less experienced traders get shaken out. They see the downward consolidation and assume the trend is reversing. Technical traders, on the other hand, recognize this pullback for what it is: a healthy pause inside a larger uptrend. The buyers still have control, and once the consolidation runs out of steam, they step back in and drive the price higher.
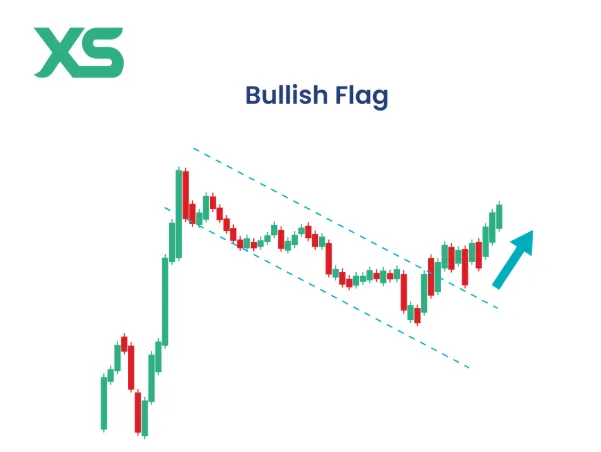
Image by XS
How to Tell a Bull Flag Apart From Similar Patterns
One of the biggest challenges in chart reading is telling one pattern from another. Several formations look similar to a Bull Flag, but each one behaves differently and carries different implications.
Bull Flag vs. Bear Flag
Both are continuation patterns with the same structure. The difference is direction. A Bull Flag forms during an uptrend and has a downward-sloping consolidation. A Bear Flag forms during a downtrend and has an upward-sloping consolidation. The structure is mirrored, but the logic is the same.
Flag vs. Pennant
In a flag, the consolidation forms a rectangular channel with parallel trendlines. In a pennant, the trendlines converge into a small symmetrical triangle. Pennants tend to resolve faster and are often seen as more aggressive because the breakout usually happens earlier.
Bull Flag vs. Ascending Triangle
An Ascending Triangle has a flat resistance level with higher lows pressing upward toward it. A Bull Flag, by contrast, keeps its boundaries parallel and slopes slightly downward. The ascending triangle signals accumulation at a specific resistance level, while the Bull Flag signals broader trend continuation after a momentum burst.
Bull Flag vs. Rising Wedge
A Rising Wedge features two converging trendlines that both slope upward. While both can involve upward price movement, a Rising Wedge is typically a bearish reversal signal, whereas a Bull Flag is a bullish continuation pattern. Getting these two confused is one of the costliest mistakes in technical analysis, because they look structurally similar at first glance but lead to completely opposite outcomes.
Getting these distinctions right matters a lot. Misidentifying a pattern can lead to poorly timed entries or false confidence in a setup that does not actually exist.
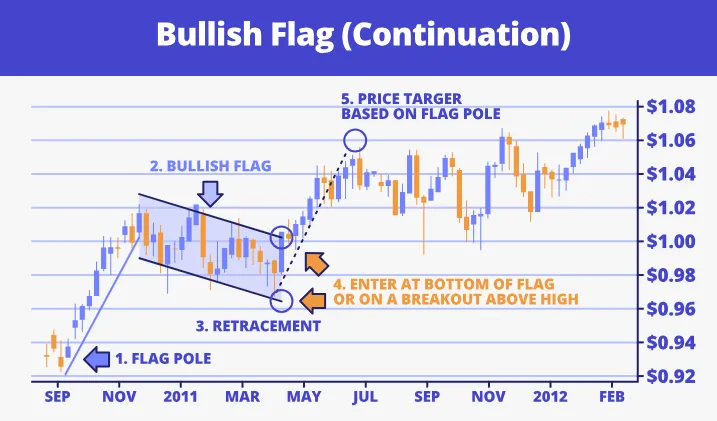
Image by thetradinganalyst.com
How to Measure the Price Target
One of the most practical aspects of the Bull Flag is that it gives you a built-in method for estimating where the price could go after the breakout. This approach is called the measured move technique.
To use it, you first measure the height of the flagpole. That means calculating the distance from the bottom of the initial rally to the top of it. Then, you take that same distance and project it upward from the point where the price breaks above the flag's upper boundary. The result is your estimated price target.
There are also a few reliability guidelines that can help you filter out weaker setups. A Bull Flag is considered most trustworthy when the consolidation does not retrace more than 38% to 50% of the original flagpole. If the price pulls back more than that, the pattern loses its structural integrity and the odds of a successful breakout decrease significantly.
Studies suggest that the Bull Flag has a success rate of roughly 67% to 72% when it is confirmed by proper volume behavior and supported by the overall market trend. That is a solid hit rate, but it also means that roughly one in three setups will fail, which is why risk management is essential regardless of how clean the pattern looks.
Real-World Examples
The Bull Flag has appeared across multiple asset classes and timeframes. Below are some of the most notable recent examples.
Bitcoin (October to November 2023)
Bitcoin rallied sharply from around $25,000 to $35,000, forming a clear flagpole driven by institutional ETF anticipation. The price then consolidated downward in a tight parallel channel for several weeks, forming the flag. Once the upper boundary broke, Bitcoin continued its rally and eventually reached over $70,000 in the months that followed. The flag phase provided one of the cleanest low-risk entry opportunities of the entire cycle.
Solana (September to October 2023)
Following a sharp move from roughly $19 to $30, Solana formed a textbook Bull Flag with a tight, downward-sloping consolidation on declining volume. The breakout from the flag preceded a sustained run that pushed SOL to multi-year highs. Traders who recognized the pattern early had a well-defined entry point with a clear stop-loss below the flag's lower boundary.
Nasdaq-100 / QQQ (Early 2023)
After the tech sector recovery rally in January and February 2023, the Nasdaq-100 formed a clear Bull Flag on the weekly chart. The consolidation held for several weeks before the breakout continued the broader uptrend. This example shows how the pattern works across not just crypto but traditional equity markets as well.
XRP (Late 2024)
During XRP's sharp rally following regulatory clarity news, the token formed a clean Bull Flag on the daily chart. The consolidation was brief and orderly, with volume contracting significantly during the flag phase. The subsequent breakout confirmed the pattern and aligned with the broader altcoin cycle rally that followed.
These examples show that the Bull Flag is not limited to one market or one timeframe. It appears in crypto, equities, and forex, and it works on everything from 15-minute intraday charts to weekly charts.
Bull Flag vs. Bear Flag: Side-by-Side Comparison

Two Ways to Enter a Bull Flag Trade
This is where the Bull Flag offers something the Bear Flag does not as frequently: two legitimate entry options, each with a different risk and reward profile. Understanding both gives you more flexibility depending on market conditions.
The Breakout Entry
The more common approach is to enter the moment the price closes a candle above the flag's upper boundary on elevated volume. This is the most straightforward entry and the one most traders learn first. The advantage is that you are entering exactly when the pattern confirms. The disadvantage is that you may be buying into a move that has already extended, and if volume is thin, you risk a false breakout.
The Retest Entry
After a Bull Flag breakout, the price will often pull back to retest the top of the flag, which now acts as support. This retest provides a second-chance entry for traders who missed the initial breakout or who want more confirmation before committing capital. The advantage is a better risk-to-reward ratio because you are entering closer to the stop-loss level. The disadvantage is that not every Bull Flag produces a clean retest, and waiting for one sometimes means missing the move entirely.
Neither entry is universally better. The choice depends on your risk tolerance, the volume profile at the breakout, and whether the broader market momentum supports getting aggressive or patient. In fast-moving crypto markets, the breakout entry is often necessary because retests can be shallow or absent. In slower equity markets, the retest entry tends to be cleaner and more reliable.
Reading Multiple Timeframes to Confirm the Setup
A Bull Flag on its own is a useful signal. A Bull Flag that aligns across multiple timeframes is a significantly stronger one. This is a concept the Bear Flag article does not cover explicitly, but it is particularly relevant for bullish setups because traders typically hold long positions longer and need higher-confidence confirmation before committing.
The principle is straightforward. If you spot a Bull Flag forming on the four-hour chart, check whether the daily chart is also in a confirmed uptrend. If the daily trend is up and the four-hour is forming a flag, the two timeframes are aligned and the setup carries more weight. If the daily trend is down or sideways, the four-hour Bull Flag is fighting the broader current, and the odds of a failed breakout increase substantially.
A practical framework is to use three timeframes: a higher timeframe to confirm the trend direction, a middle timeframe to identify the Bull Flag setup, and a lower timeframe to time the entry precisely. For example, using the daily to confirm a bullish trend, the four-hour to spot the Bull Flag, and the one-hour to enter on the breakout candle. This approach reduces the chance of trading against the dominant market direction and gives your entry much greater structural support.
What Makes the Pattern Fail
No pattern is perfect, and the Bull Flag comes with real risks that advanced traders need to account for. The biggest one is the false breakout.
A false breakout happens when the price briefly pushes above the upper boundary of the flag but then reverses sharply back into or below the consolidation range. This can happen for a few reasons. Sometimes the buying volume at the breakout point is just too low to sustain the move. Other times, it is the result of deliberate stop hunting by larger players who know exactly where retail buy orders and stop-losses are clustered.
Large market participants are fully aware that Bull Flags are popular among retail traders. They know that breakout buy orders accumulate just above the flag's upper boundary. They can push the price briefly above that level to trigger those orders, collect that liquidity, and then reverse the direction. In crypto markets especially, this kind of behavior is common because of the relatively thin liquidity compared to traditional finance.
To protect against false breakouts, traders should look for the following confirmation signals: a clear increase in volume at the moment of the breakout, RSI or other momentum indicators pointing upward without divergence, the broader market trend aligned with the trade direction, and no major resistance levels sitting immediately above the breakout point. A candle close above the upper flag boundary — rather than just a wick through it — adds an important layer of confirmation. Without these signals in place, acting on a Bull Flag breakout is essentially a gamble dressed up as analysis.

Image by XS
How Crypto Markets Change the Rules
The Bull Flag behaves a bit differently in crypto compared to traditional markets, and it is important to understand why.
Traditional stock markets have opening and closing hours. Price gaps can form overnight or over weekends, and these gaps often serve as the starting point of a flagpole. Crypto markets run 24 hours a day, seven days a week. There are no gaps. Instead, flagpoles are built from continuous active trading, which often makes them sharper and more extreme than their equity market equivalents.
Crypto also tends to resolve flag patterns much faster. A Bull Flag that might take two to three weeks to play out in equities can form and complete in just a few days or hours in crypto. This faster pace means traders need to monitor positions more actively and set tighter time-based risk parameters.
Another important difference is the additional data available to crypto traders. Beyond standard chart volume, you can validate a Bull Flag using exchange inflow and outflow data, funding rates on perpetual futures contracts, open interest levels, and liquidation heatmaps. If a breakout occurs alongside rising open interest and positive funding rates, the momentum is being backed by real capital commitment. If volume is rising but open interest is flat or falling, the breakout may be driven by short covering rather than fresh buying, which tends to produce shorter-lived rallies.
How to Use the Bull Flag Without Getting Trapped
The Bull Flag is more than a shape on a chart. It is a map of buyer dominance that gives traders a structured approach to entering positions during an uptrend. But the structure alone is not enough. The pattern only becomes actionable when it is confirmed by multiple factors working together.
Volume needs to drop during the flag and spike at the breakout. Momentum indicators like RSI should be pointing upward without bearish divergence. The broader market trend, including macro conditions and sector momentum, should support continued upside. The consolidation should stay within the 38% to 50% retracement range of the flagpole to preserve structural validity. And ideally, the setup should align across at least two timeframes before you commit capital.
When all of these pieces line up, the Bull Flag offers one of the cleanest risk-to-reward setups available to a technical trader. Entry is placed on the breakout candle above the flag's upper boundary, or on a retest of that level if you are taking the more conservative approach. The stop-loss sits just below the flag's lower boundary. The price target is the flagpole distance projected upward from the breakout point. That gives you a precisely defined risk and a clearly defined reward before the trade is placed.
When even one piece is missing, the odds shift. The difference between a profitable trade and a costly mistake often comes down to patience and confirmation, not just recognizing the shape on the chart.