[Practical Guide] Don’t Get Washed Out! Identify the 3 Key Signs of “Fake Breakouts” and Use Volume to Spot Whale Traps
 LBank 官方中文2026-03-12
![[Practical Guide] Don’t Get Washed Out! Identify the 3 Key Signs of “Fake Breakouts” and Use Volume to Spot Whale Traps](/static-backend/media/customer/creatorSystem/31025444-a9ca-4543-9615-6c18f757bc1e.png?x-oss-process=image/format,webp)
[Practical Tutorial] Stop Getting Washed Out! Identify the 3 Key Signs of a "Fake Breakout" and Learn How to Use Volume to See Through Whales' Traps
Definition of False Breakout (Highs/Trendlines/Ranges)
Simply put: Breakout → Fails to hold → Pulled back. Although the price pushed through, it failed to establish effective support or resistance conversion. Instead, it became a bull trap (or bear trap) signal, with the price ultimately retracting back into its original structure.
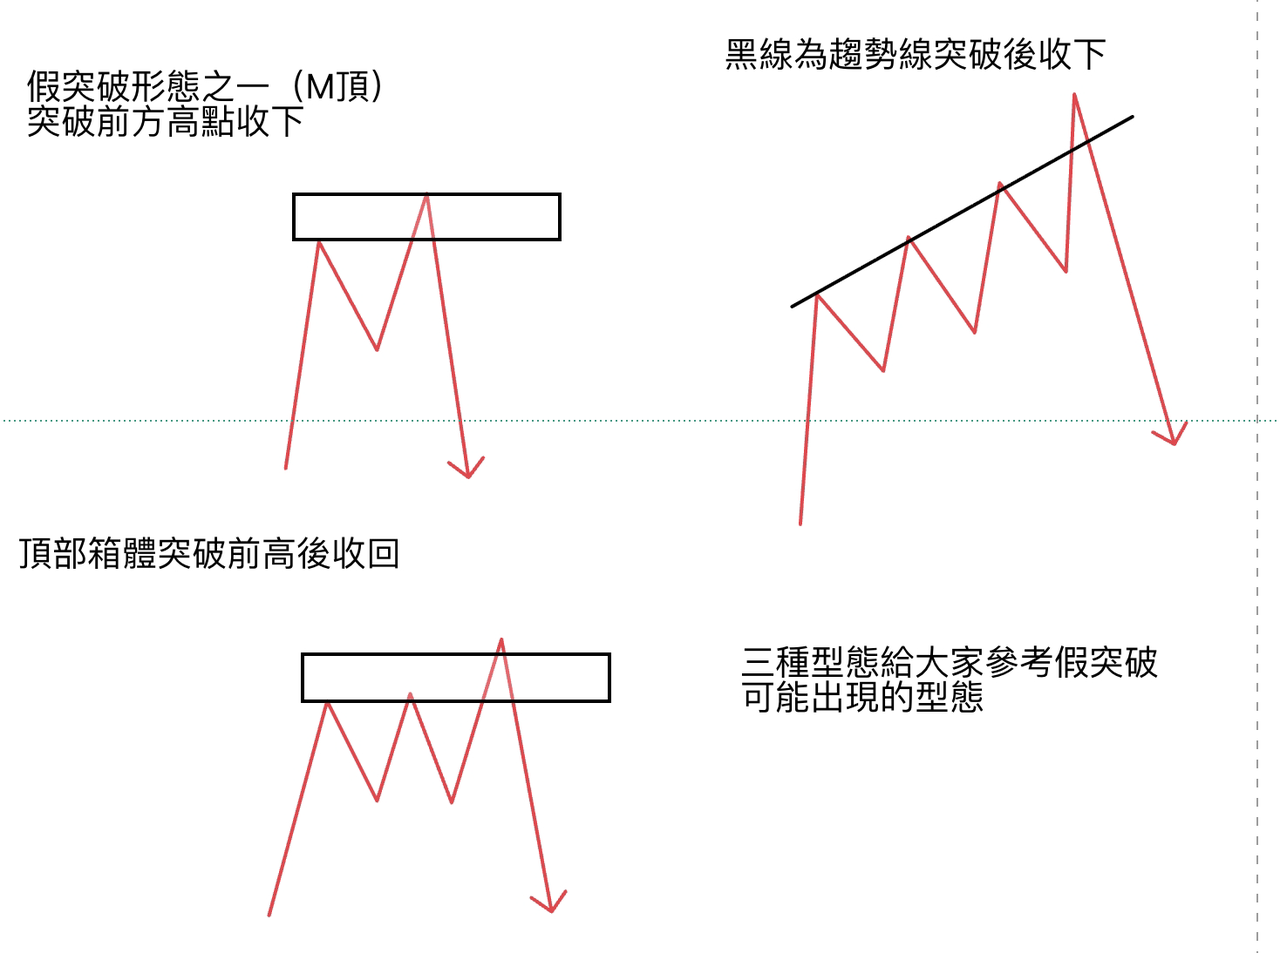
How to Identify False Breakouts? Range Structure Edition
When the price is consolidating within a range, you can look at these three key points to identify a false breakout:
- Volume Confirmation: Was the breakout of the resistance level accompanied by significant volume?
- Key Levels: Was the price reaction at the edge of the range (previous high/previous low) decisive?
- Pump and Dump: Observe if there's a rapid pump upwards, followed immediately by a sharp reversal back into the range.
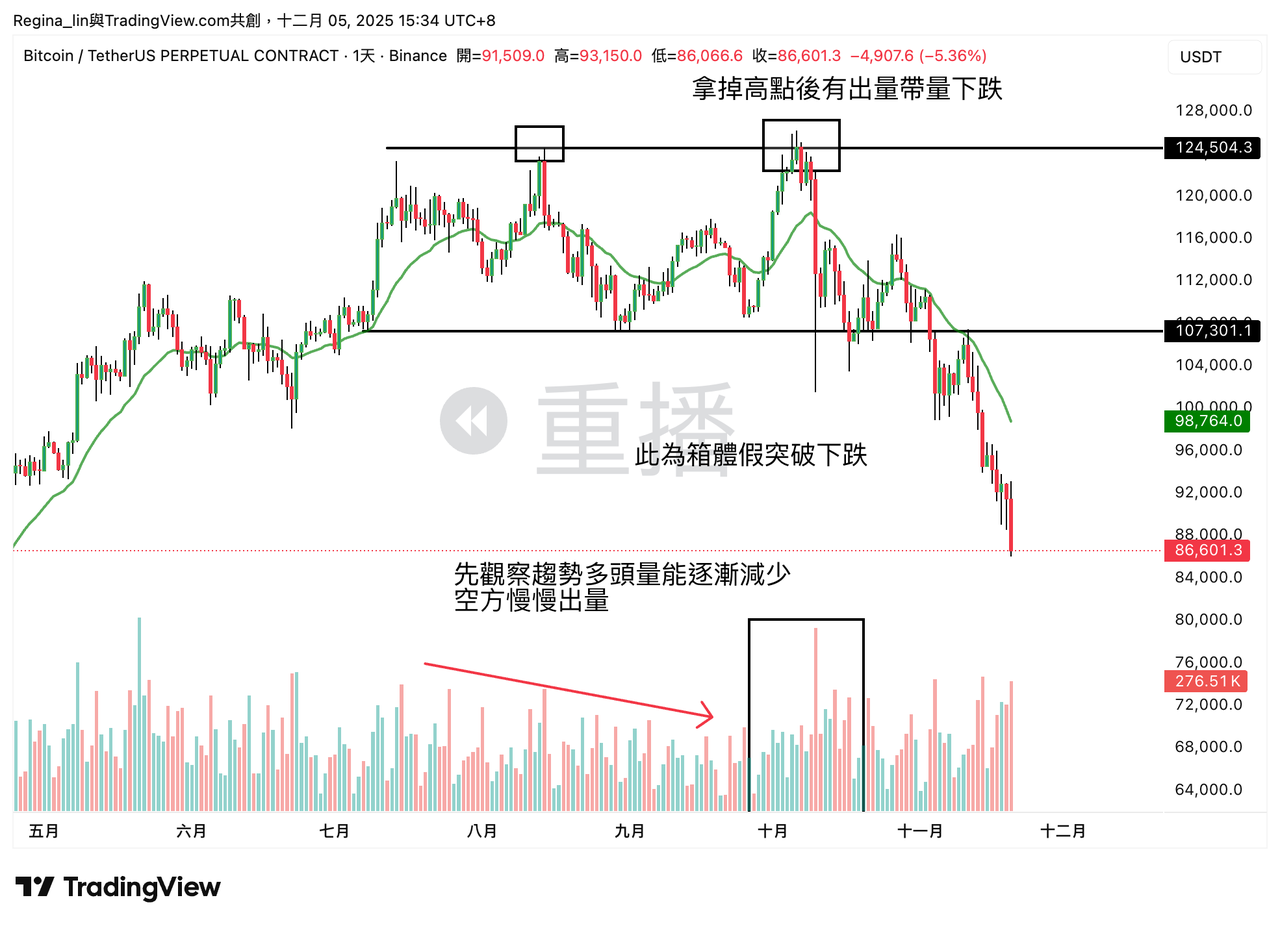
How Volume Confirms Chart Patterns
The core of chart pattern analysis must be coupled with volume; patterns without volume are just empty shells.
▶ What does high volume indicate?
It means "real money" is entering the market, indicating market consensus. Only then can this force be considered genuine.
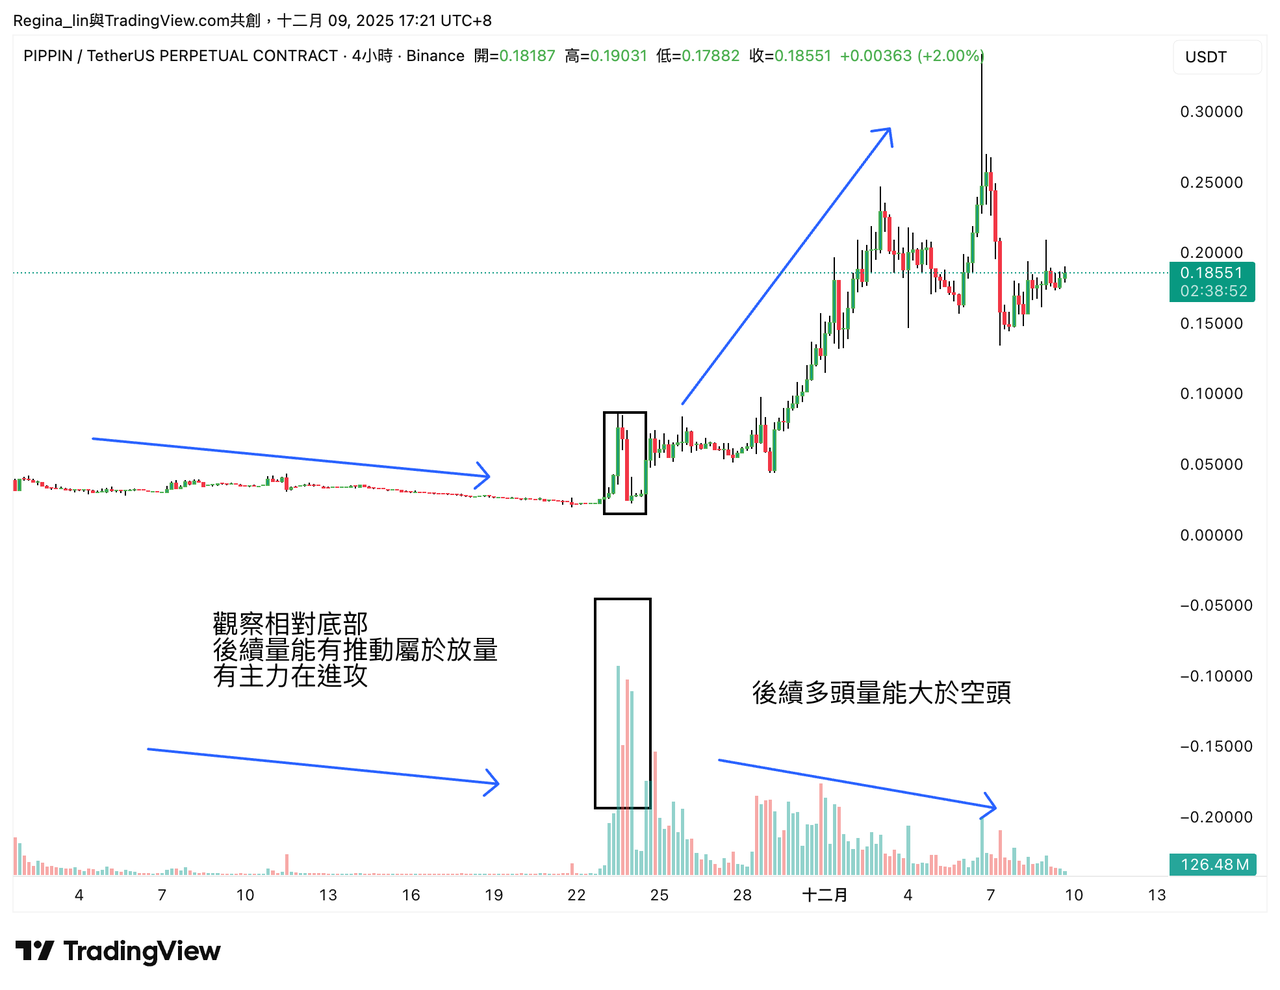
▶ What does low volume indicate?
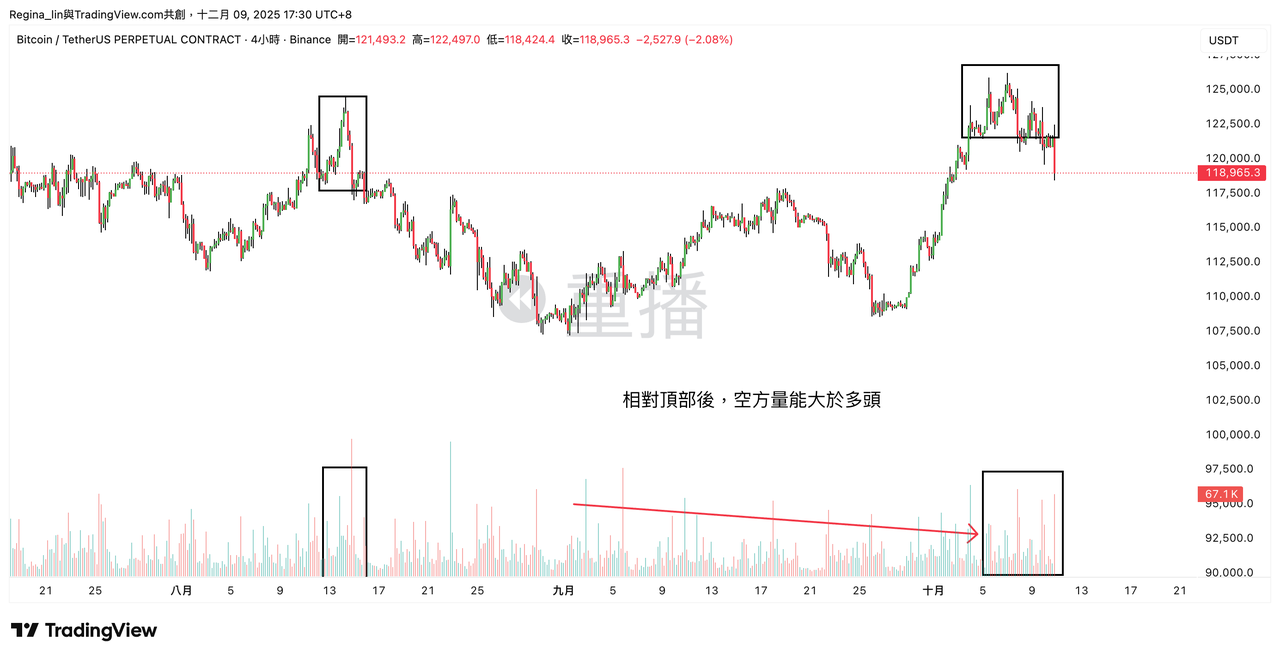
It means the price cannot be pushed further, or there's a strong wait-and-see sentiment in the market. Typically, low volume at relative tops or bottoms is a warning sign of a reversal.
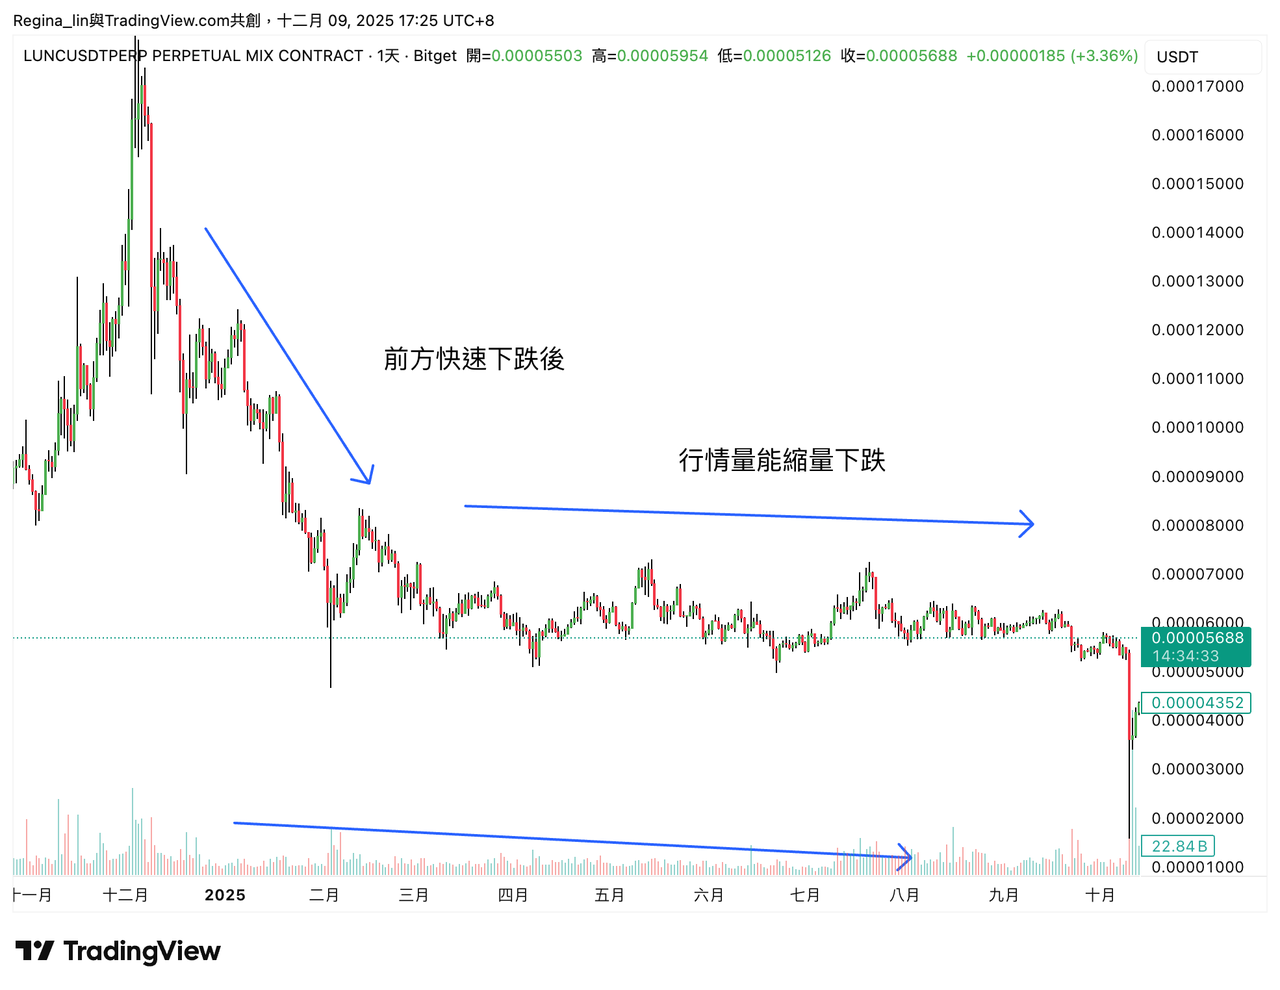
▶ Common Ways to Judge
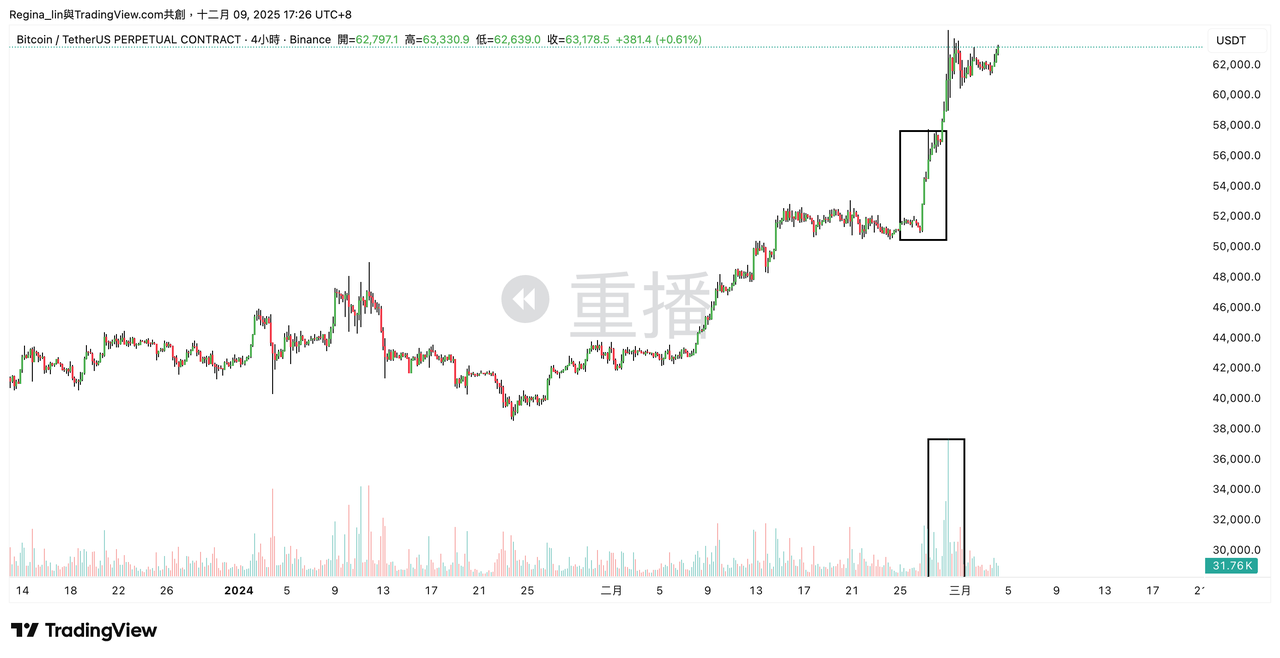
- Volume Breakout: Strong bullish momentum, high probability of a true breakout.
- Low Volume Ascent: Indicates inability to push higher. At relative tops, if there's no sustained bullish volume, the market is highly likely to retrace.
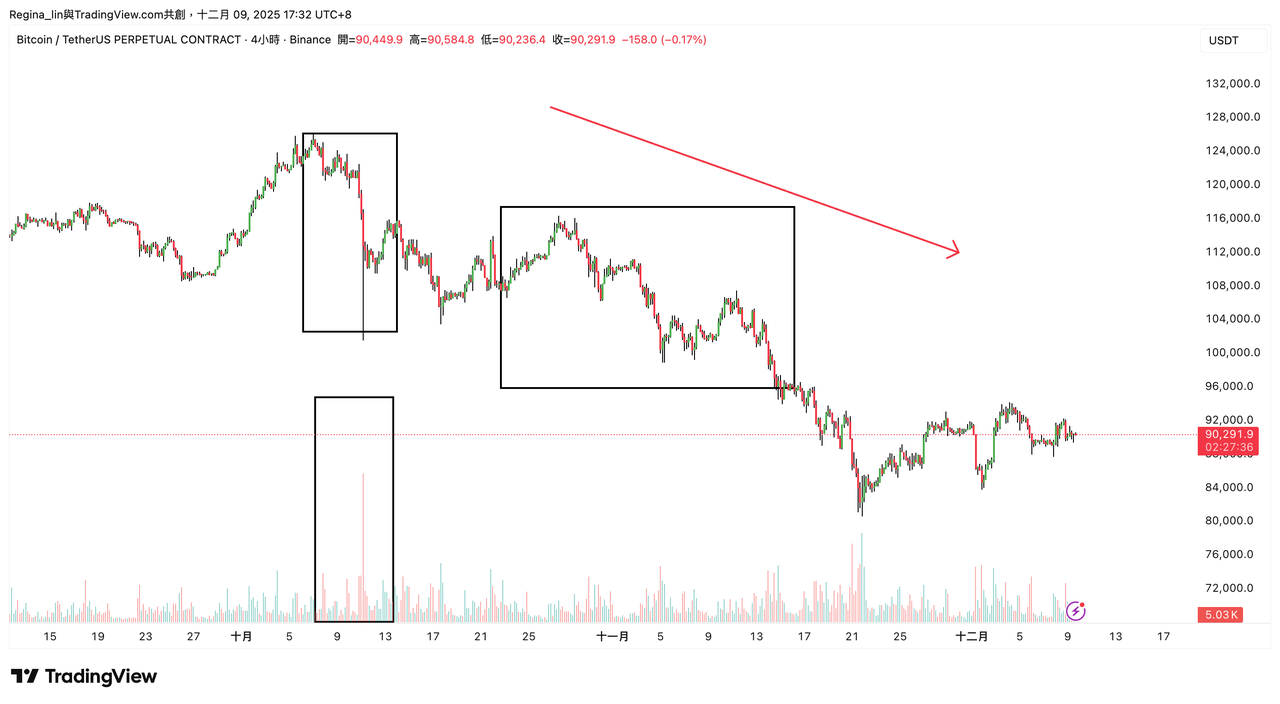
- Volume Decline: Accelerated panic. Strong bearish momentum, the downtrend might not be over yet.
4 Practical Steps
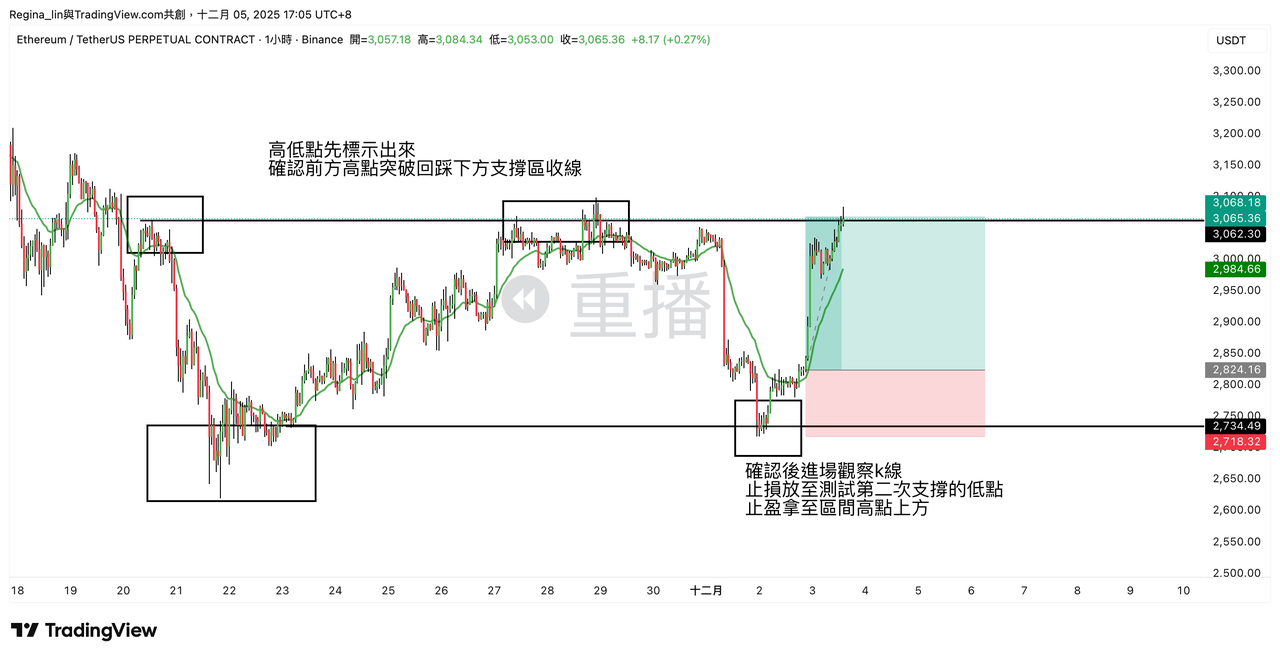
1. Confirm the Current Trend: Primarily use daily or four-hour charts to first observe the overall direction.
2. Identify Key Zones: Confirm the trend's highs and lows (bears look for resistance, bulls look for support).
3. Observe Candlestick Strength: Look for reversal candlesticks in key zones (e.g., Hammer, Inverted Hammer, Bullish Engulfing, Bearish Engulfing). You can refer to the previous candlestick tutorial article [link here].
4. Verify Volume:
a. Resistance Zone Scenarios:
(1). When reaching a relative top zone, if bullish volume decreases and bearish volume starts to emerge or even surpass bullish volume, followed by a volume surge, it indicates a bearish trend reversal -> Consider short-term range short trades.
(2). When reaching a relative top zone, if there is a breakout with a large green candlestick, and bullish volume also increases, it indicates a high probability of trend continuation -> Consider breakout long trades.
b. Support Zone Scenarios:
(1). When reaching a relative bottom zone, if bearish volume decreases and bullish volume starts to increase and surpass bearish volume, followed by a volume surge, it indicates a bullish trend reversal -> Consider short-term range short trades.
(2). When reaching a relative top zone, if there is a large red candlestick closing below the previous low with a short wick, and bearish volume also increases, it indicates a high probability of trend continuation -> Consider breakout short trades.
P.S. For advanced use, Fibonacci Retracement can be combined to precisely define whether a false breakout is valid.
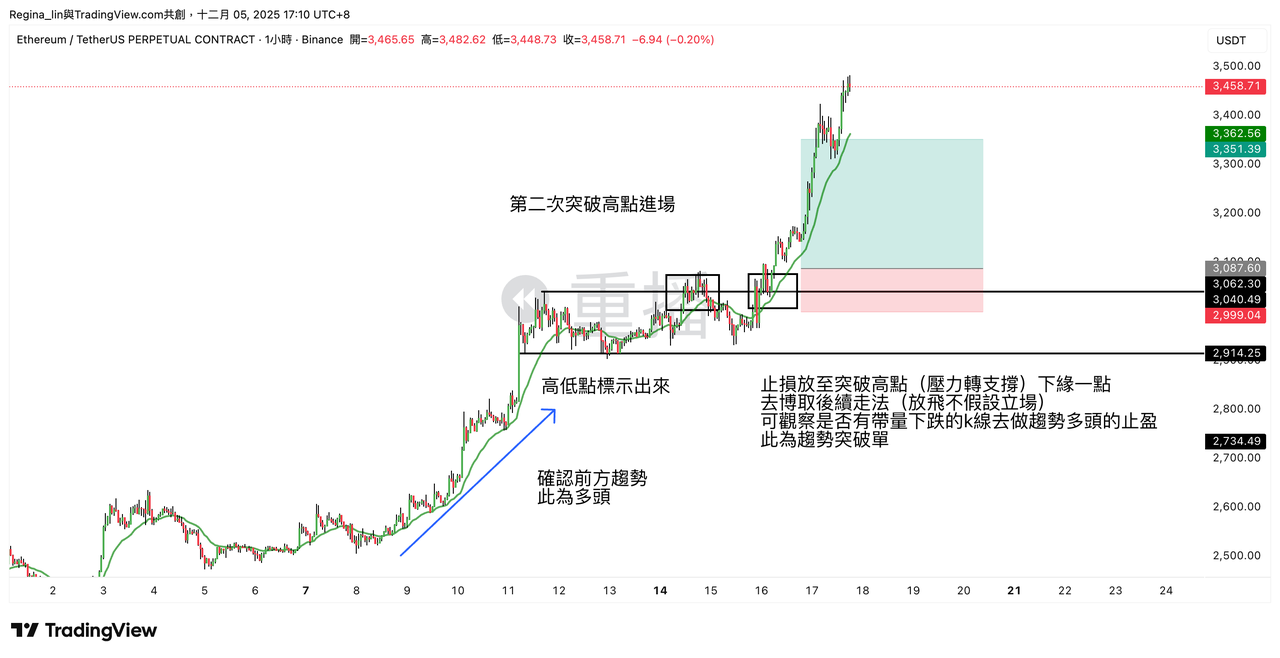
Common Mistakes for Beginners
- Over-reliance: Believing that if a pattern appears, it "will definitely" play out.
- Ignoring the Trend: Not combining with the broader trend, trading against the trend.
- Ignoring Volume: Only looking at the chart's appearance, not the underlying trading volume.
- No Stop-Loss: This is the most fatal mistake. Not setting a stop-loss.
- Blindly Chasing Price: Rushing in upon seeing a breakout, most susceptible to being shaken out by false breakouts.
Limitations of Chart Pattern Analysis
- Probability Issue: Patterns are merely probabilities, not 100%. We are engaging in expectation value trading.
- Trend Priority: The major trend is always more important than a single pattern.
- Not in Isolation: Do not enter a trade based solely on one pattern. Multiple confirmations are required, such as combining with candlesticks, observing price action, considering news, observing volume, and using other trading systems.
- Inability to Predict Timing: Knowing it will "pump," but not knowing when.
- Timeframe Differences: Smaller timeframes (e.g., 15-minute charts) are more prone to fake signals or whipsaws.