Moving Averages Only Look at Crossovers? A 3-Minute Beginner's Guide to MA/EMA
 LBank 官方中文2026-03-13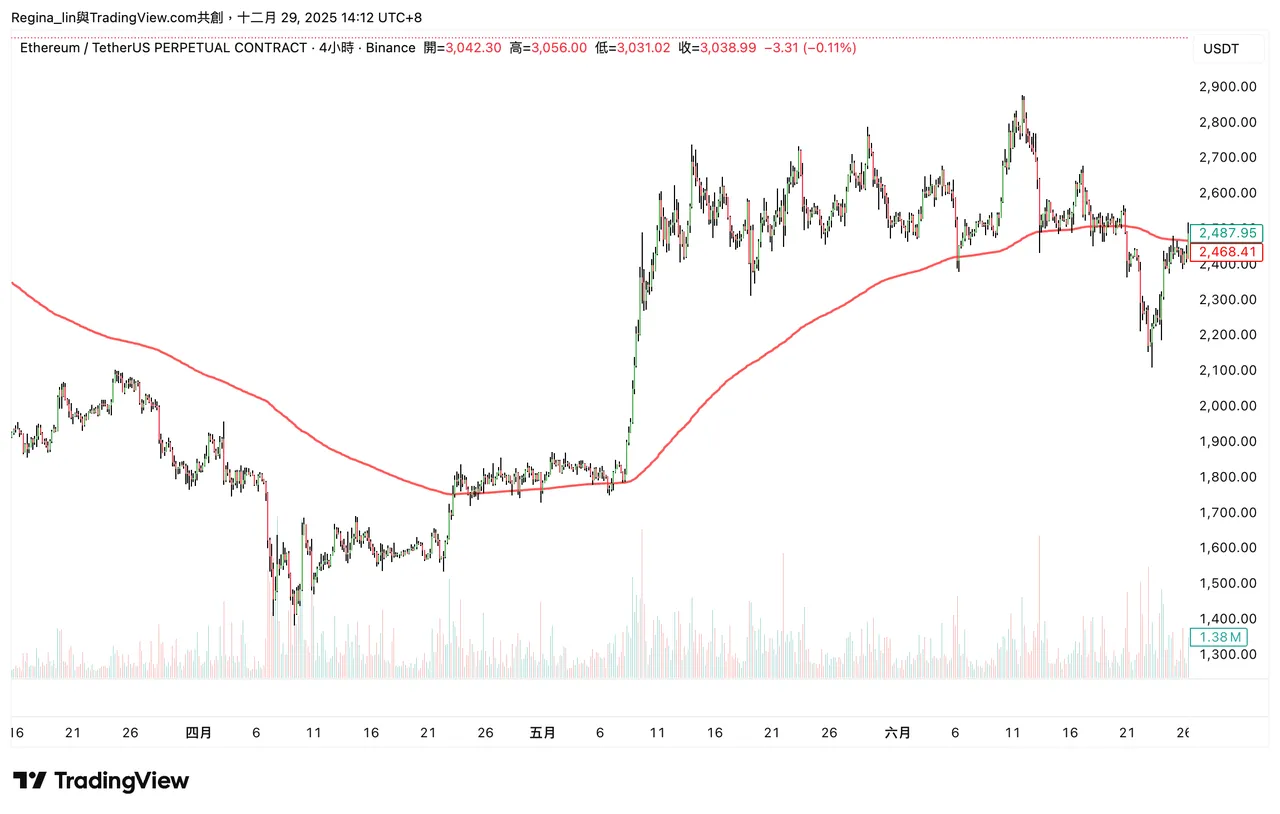
Moving averages are not meant to be used solely for waiting for crossovers to enter the market. They represent the market's average cost line and are used to confirm direction, filter out noise, and reduce the chances of being stopped out. If you only use moving averages to wait for crossovers, you will always be lagging behind.
1. What is MA? Why is it better suited for long-term analysis?
MA stands for Simple Moving Average. What you usually see as an 'average line' is typically this one.
The Logic of MA
The closing prices of N candlesticks are added up and divided by N.
= An 'average cost line'
= The 'arithmetic mean' of the candlestick closing prices
Advantages: Stable, filters out noise. Suitable for identifying major trends, filters out short-term noise, and is not easily influenced by one or two irregular candlesticks.
Disadvantages: Not sensitive enough to sudden strong price increases or decreases, often reacts with a delay.
The positioning of the MA is therefore very clear:
Suitable for observing trends, confirming direction, and verifying one's own assessment, but not for identifying turning points or for direct entry or exit.
2. What is EMA? Why is it preferred for short-term analysis?
EMA (Exponential Moving Average) is a more sensitive and market-responsive average line than the MA.
The biggest difference from MA can be summarized in one sentence:
EMA weighs 'recent prices' more heavily.
This means that as soon as the market changes, the EMA reflects this faster in the average line.
In the volatile, fast-moving crypto market with many false breakouts, this characteristic is very advantageous.
The shorter the EMA → the more sensitive, faster reacting, closer to the current price, and easier to turn. The longer the EMA → the more stable, fewer false signals, but slower reaction.
A small example shows why EMA is faster than SMA:
Assume the closing prices for three days are: 10, 12, 14
SMA (3 days):
10+12+14/3=12
EMA (3 days):
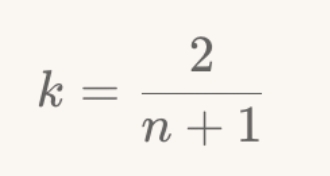
Calculate the smoothing constant k=2/(3+1)=0.5
Set the first EMA = the first price (10) [Starting value]
Second day:
EMA2=(12×0.5)+(10×0.5)=6+5=11
Third day:
EMA3=(14×0.5)+(11×0.5)=7+5.5=12.5
One can see that the EMA is closer to recent price changes than the SMA.
3. Differences between EMA and SMA
Indicator | Reaction Speed | Characteristic | Purpose |
MA | Slow | Average of all prices | Long-term trends |
EMA | Fast | Recent prices weighted more heavily | Short-term / Trending markets |
A summary in one sentence:
For quick reactions → use EMA. For stability and to avoid errors → use SMA.
4. Uses of EMAs with different periods
EMA | Function | Purpose |
EMA 7 / 10 | Most sensitive | Short-term direction |
EMA 12 / 20 | Dominant trend line | Most commonly used momentum line by traders |
EMA 30 | Medium-term trend | Retest entry point, breakout confirmation |
EMA 100 | Higher-level strength | Bullish/Bearish shift |
EMA 200 | Very long-term trend, lifeline | Bull-bear boundary, strength assessment |
Everyone can find the most suitable EMA values for their strategy through backtesting. Beginners are recommended to primarily use the EMA 30 & 200 lines. A video guide can be found here -> https://youtu.be/K4MZ-y_6wp0?si=iDOveJ-5sp41Kko1
5. Simple Interpretation of Individual EMA Signals
📍 EMA rises → bullish momentum increases
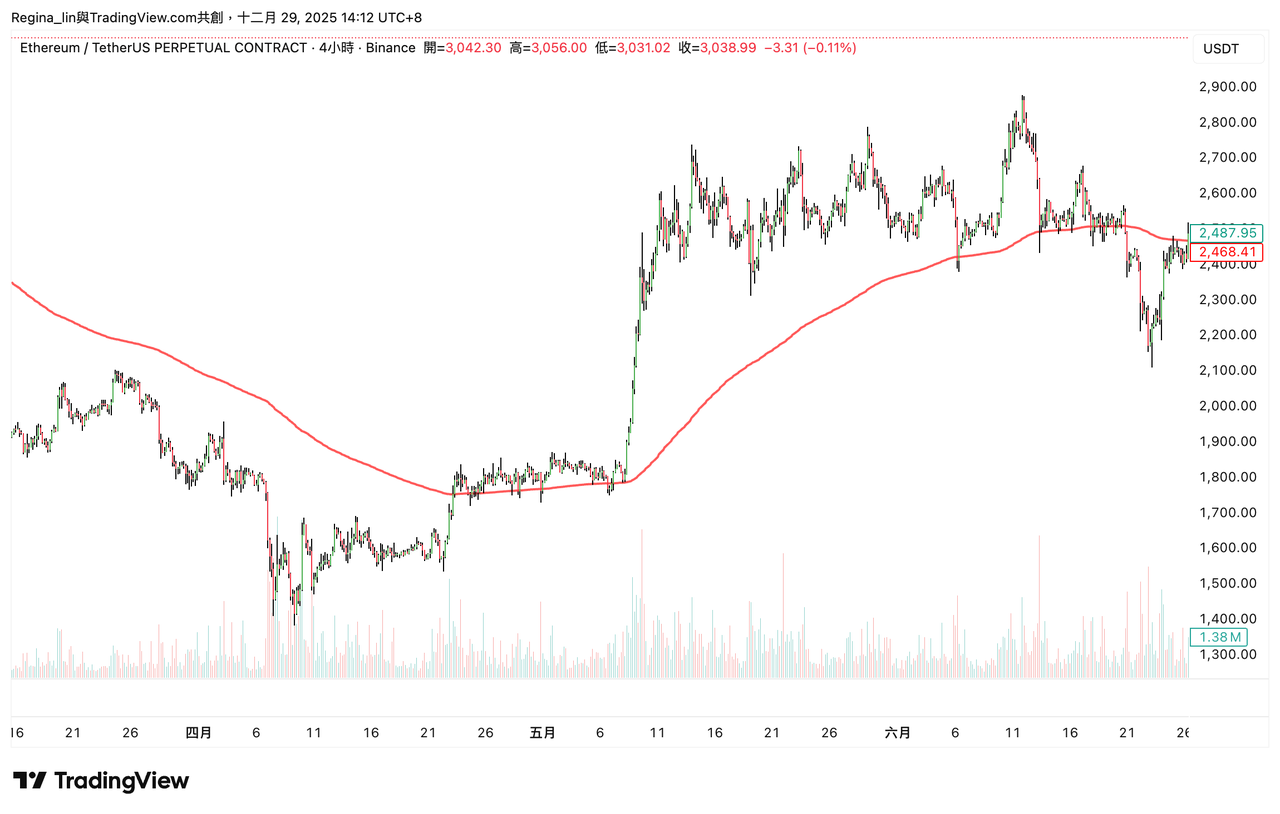
📍 Price above the EMA line → bullish dominance
- EMA becomes support
- Retest holds = further increase
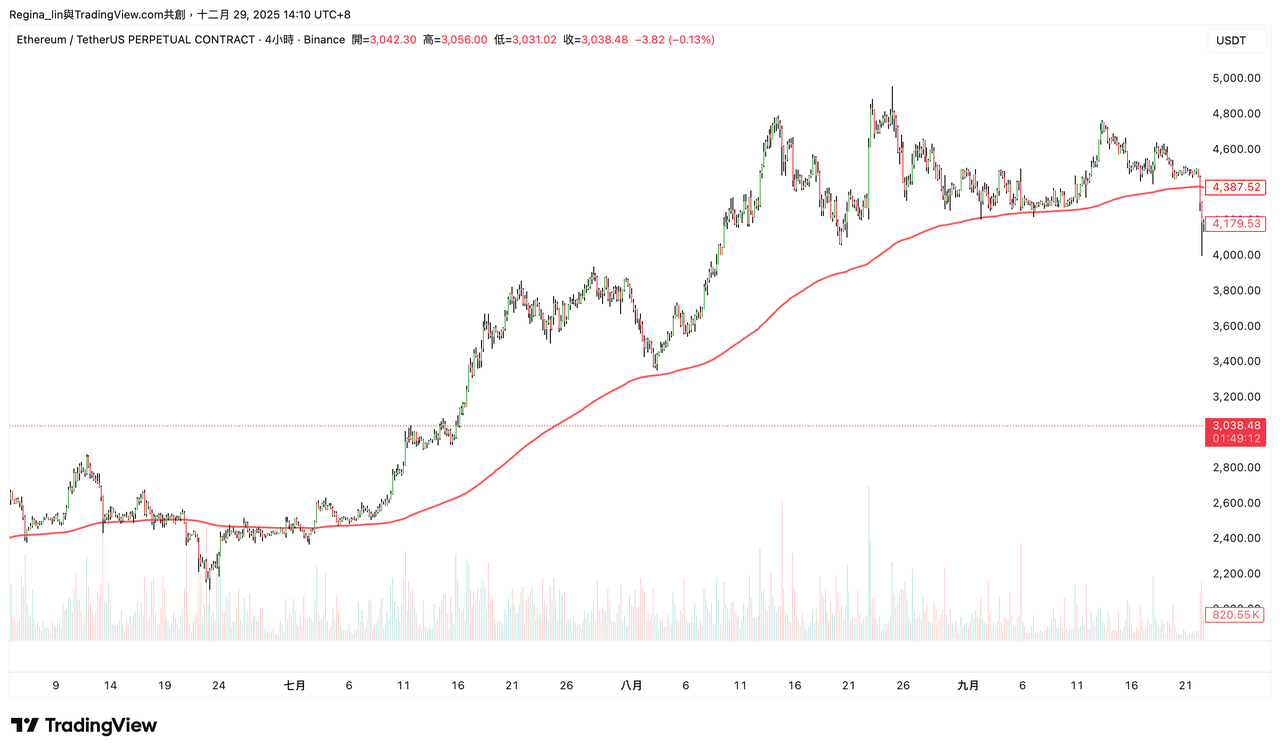
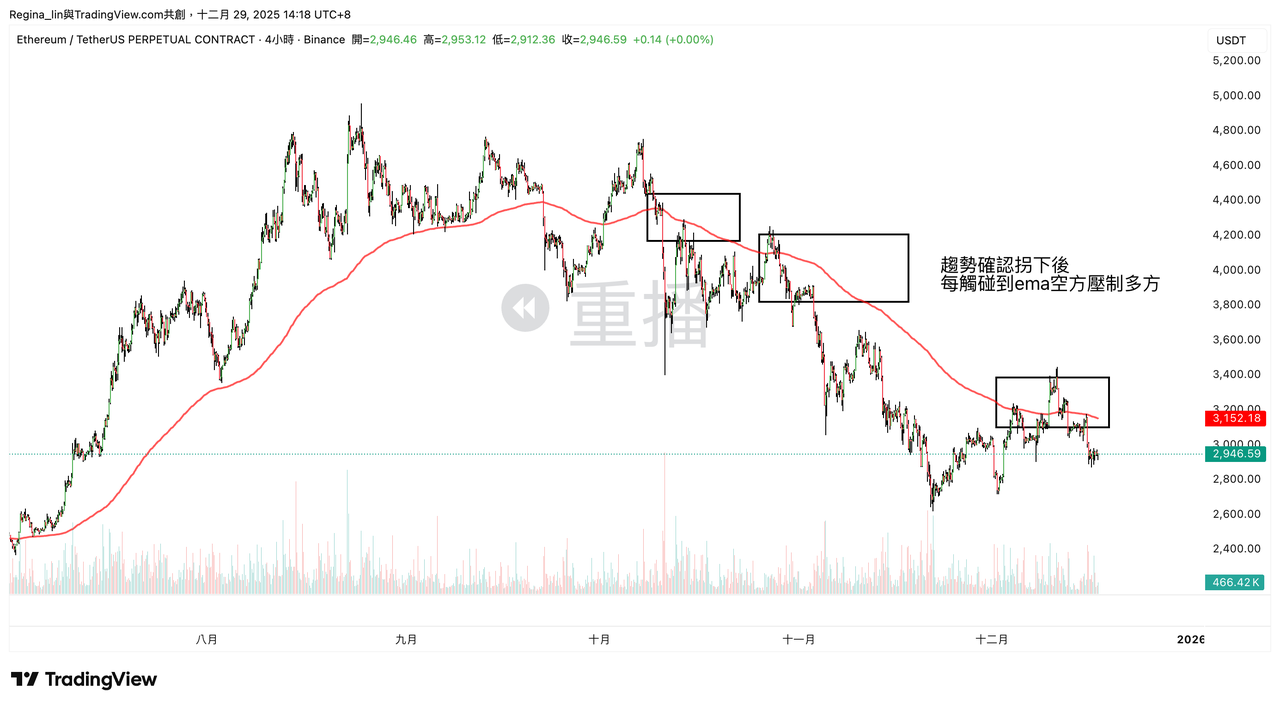
📍 EMA falls → bearish momentum increases
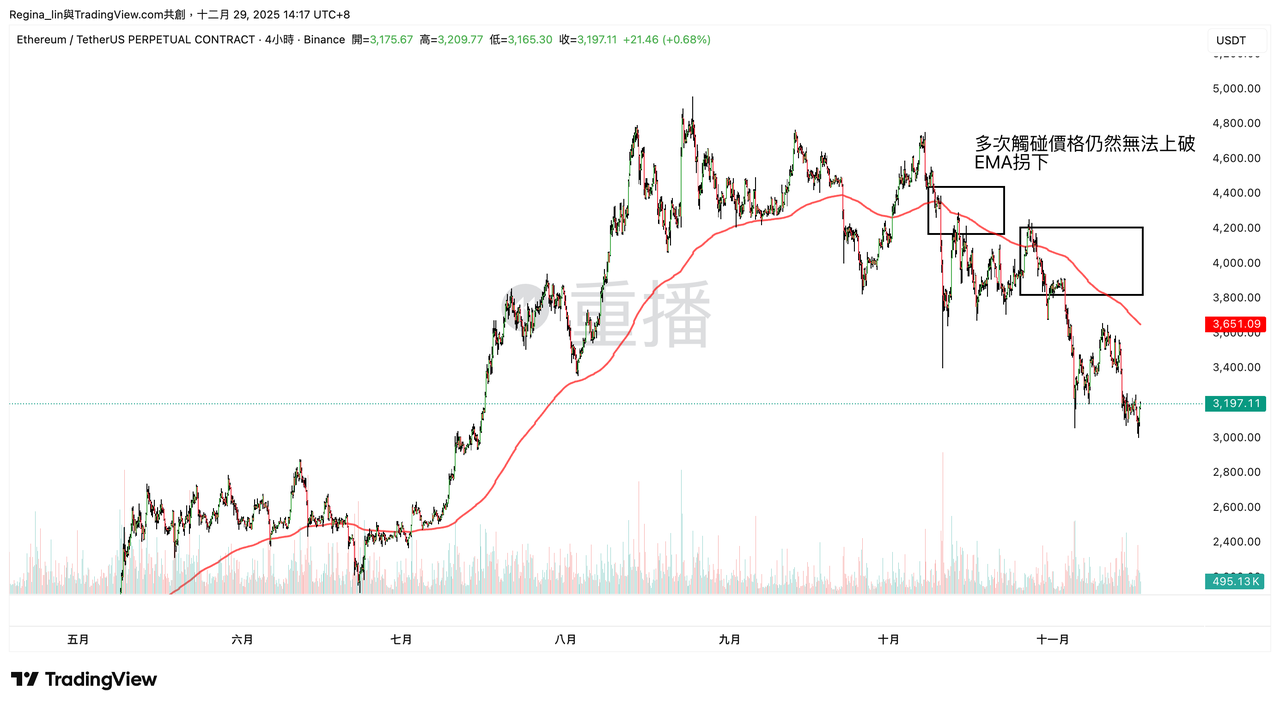
📍 Price below EMA → bearish dominance
- EMA becomes resistance
- Bounce off EMA often leads to price declines
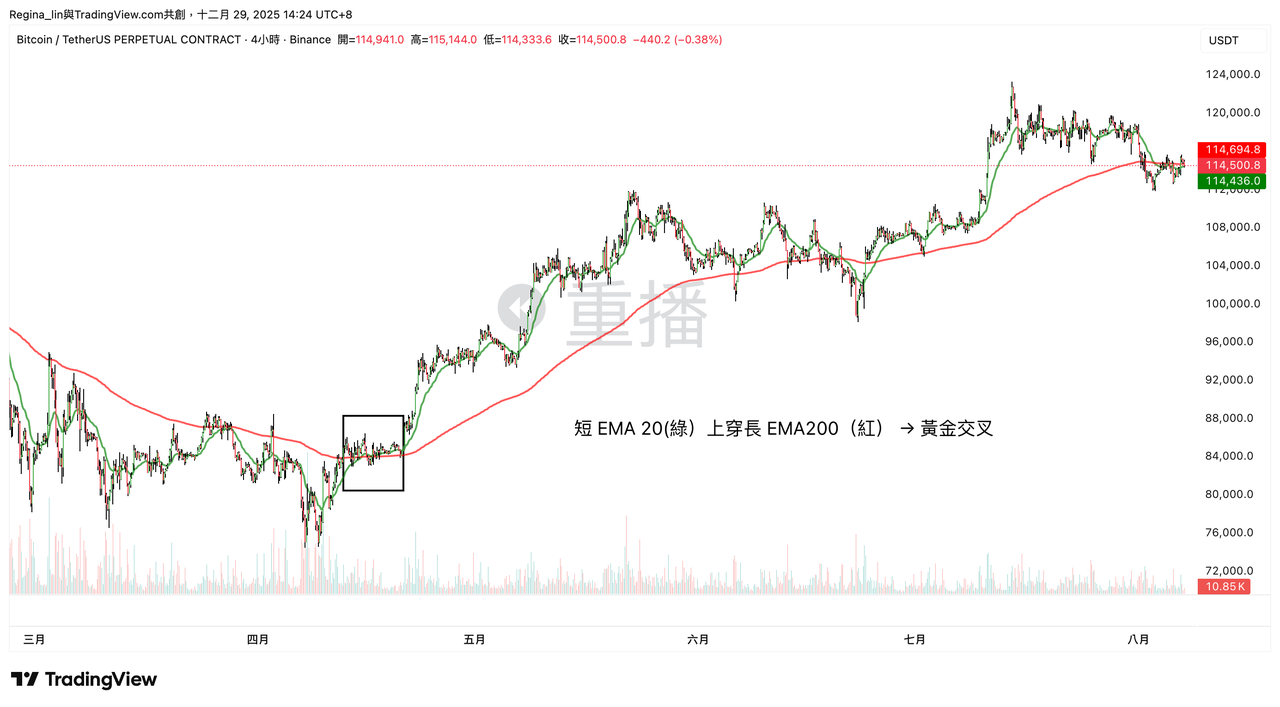
6. How to interpret a double EMA crossover? Consider it only as a 'reminder'.
Common crossover strategies:
- Short EMA crosses long EMA upwards → Golden Cross (bullish biased)
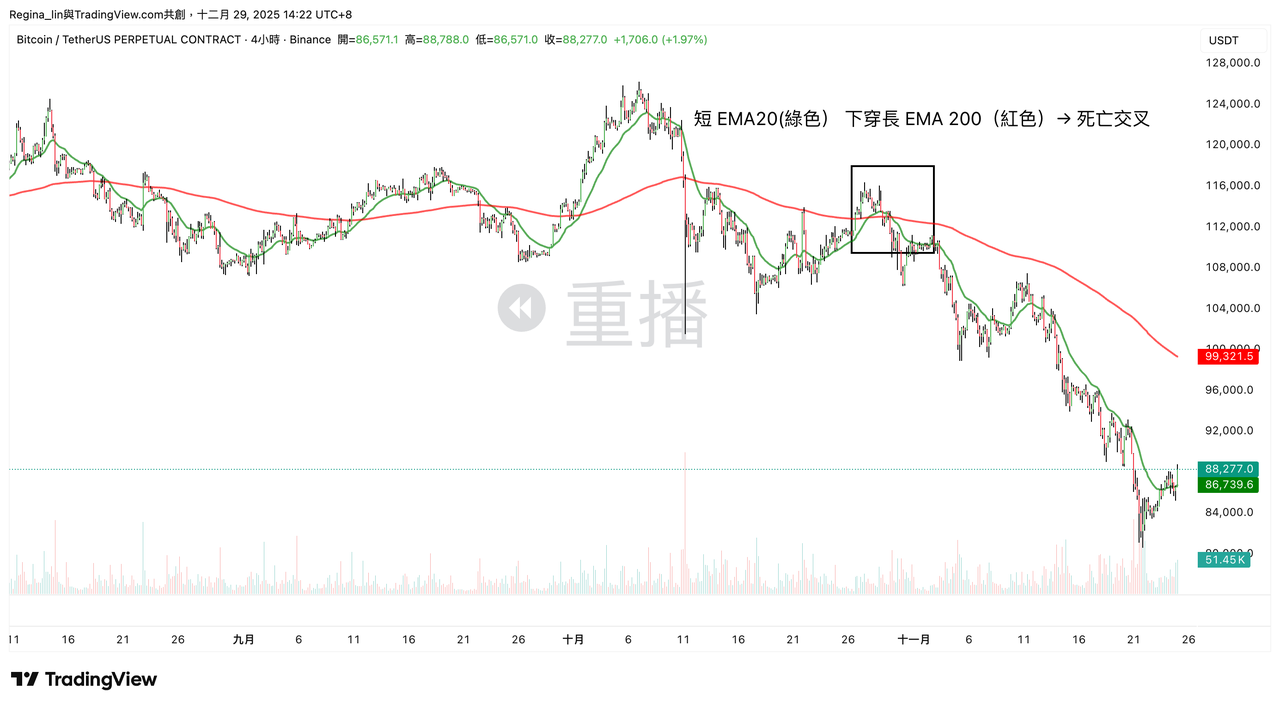
- Short EMA crosses long EMA downwards → Death Cross (bearish biased)
A crossover is not a direct trading command, but merely confirms the transition of a previous trend.
Whether to actually enter depends on:
- The current trend
- The price position
- Whether volume follows through
- Whether one is near important resistance/support areas
7. Multiple Moving Averages: For Determining Bull and Bear Markets
Most common is the system with three lines for short, medium, and long periods. 20 / 50 / 200 is recommended:
Condition | Interpretation |
20 > 50 > 200 | Super Bull Market |
20 < 50 < 200 | Super Bear Market |
3 lines intertwine | Consolidation, accumulation by large investors |
Uses:
- Follow trends
- Assess whether the market is bullish or bearish
- Filter false breakouts / false reversals
8. Combining EMA Lines + Candlesticks to Significantly Improve Signals
EMA can help us assess the stability of the candlestick structure. The following examples show an uptrend.
📍 Candlestick moves away from EMA → Prone to corrections (price tends to return to the average)
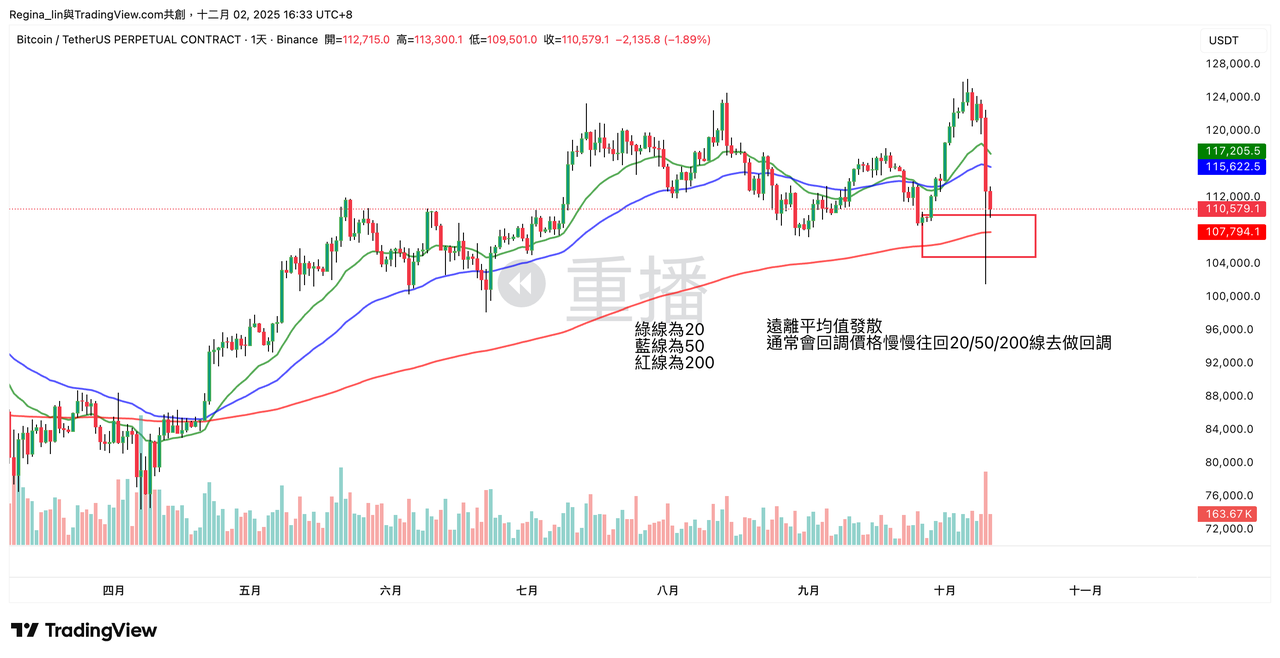
📍 Trending EMAs in bullish order, price tests EMA + bullish candlestick (e.g., Hammer) appears → Strong bullish movement, buyers take over
Wait for the candlestick to close above the moving average (or break through the previous bullish candlestick), then a long entry can be attempted, with a stop-loss 1% below the previous low.
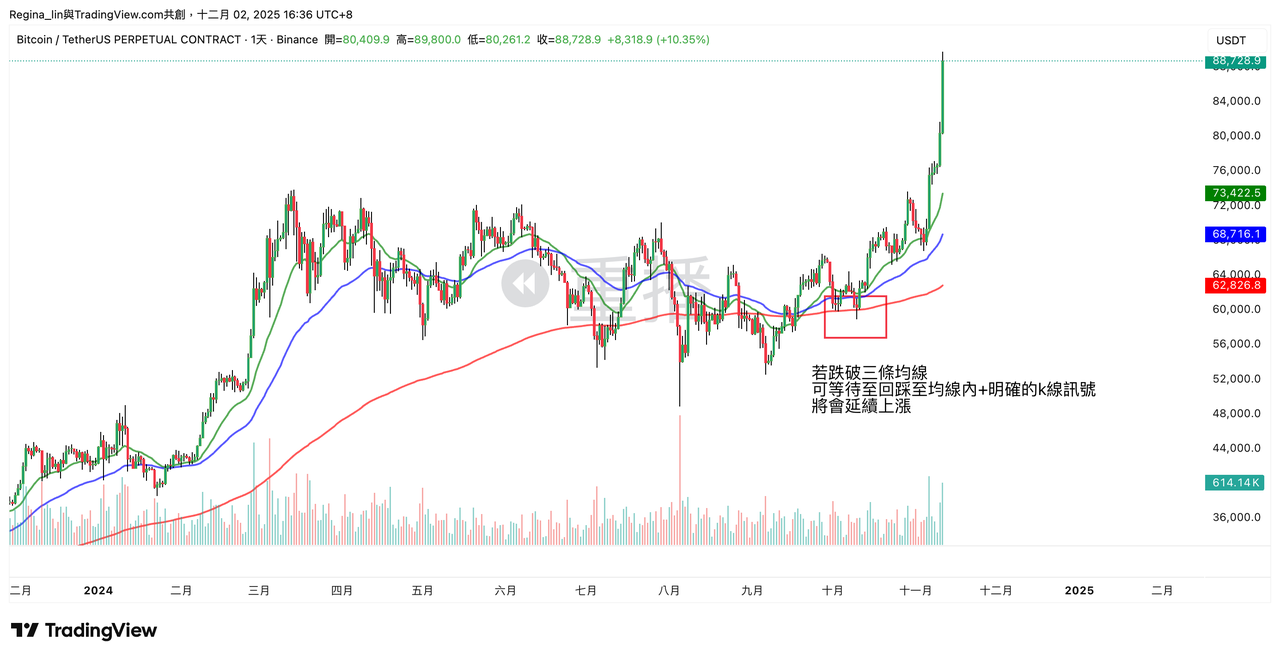
📍 Retest of the EMA fails, candlestick cannot close above the EMA, but breaks downwards, or multiple "Doji" candles appear → Weakness signal
At this point, if a bearish trend is not yet confirmed or if one is more conservative, one does not necessarily have to go short; however, one can gradually close spot positions or long positions.

9. The 5 Most Common Mistakes Beginners Make with Moving Averages
- Trading solely based on a Golden Cross (very easy to be misled)
- Opening too many EMA lines (becomes cluttered)
- Only looking at moving averages and ignoring candlesticks & volume (false breakout)
- Using EMA for counter-trend trades (one is easily overwhelmed by the trend)
- Ignoring time frame changes (1H and 4H yield different results)
Moving Averages are not a Prophecy, but a Guide
Moving averages are not for prediction, but for confirming whether we are moving in the right direction.
If you feel that moving averages are often ineffective, it's usually not because they are inaccurate, but because you have overly high expectations of their performance.
For more information, please see the instructional videos:
https://youtu.be/jT8QlA9FkT8?si=_x96qUYJyEL5Pynk