Candlestick Charts Made Simple? Rethinking Candlesticks from a Trader’s Perspective (Part 1)
 LBank 官方中文2026-02-22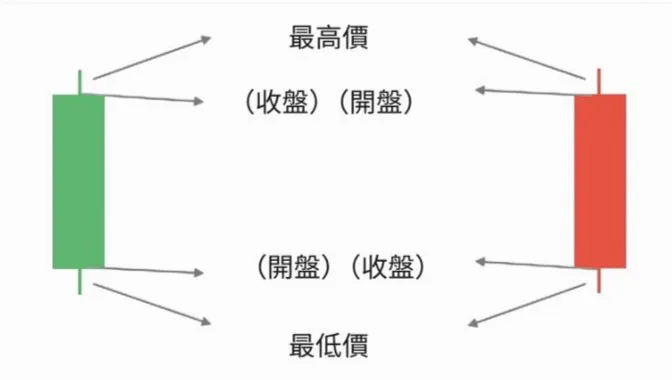
The candlestick chart is essentially the language of market sentiment. When you understand candlesticks, it's like being able to hear what the market is "saying" right now. Many people start learning trading by studying candlesticks, but it's also where most get stuck. The reason isn't that candlesticks are difficult, but because no one teaches you how to view them from a trader's perspective. In this article, we will first clarify the basic logic behind candlesticks.
1. What is a Candlestick?
A candlestick (also known as a K-line) is a charting method used to represent price changes over a specific period of time. It includes:
• Open
• Close
• High
• Low
Whether you are looking at a 1-minute, 15-minute, or daily chart, every single candlestick is the result of the battle between bulls and bears during that period.
2. The Five Basic Structures of a Candlestick
🔹 1. Body: The price change from opening to closing.
• Red: Close > Open → Bulls win
• Green: Close < Open → Bears win
🔹 2. Wick / Shadow: Prices that were reached but not maintained.
• Upper Wick: Bulls once pushed the price higher, but were driven back by selling pressure.
• Lower Wick: Bears once pushed the price lower, but were pulled back by buying power.
👉 The longer the wick, the more effort that side exerted without success.
🔹 3. Color: Used to judge direction (Bullish/Bearish).
In the crypto world, the most common color scheme is the same as the US stock market: green for gains and red for losses (you can adjust the colors on your interface based on your preference). Color is just a tool; the key is to use what you are comfortable with.
🔹 4. Position
The same candlestick can have completely different meanings depending on where it appears.
You should first determine if the current price is at a high level, a low level, or within a consolidation range, and then observe the reaction of the corresponding candlestick.
🔹 5. Patterns
A single candlestick is just a word; consecutive candlesticks form a sentence.
The rhythm of the market is hidden within the arrangement of the candlesticks.
3. Common Candlestick Patterns
1️⃣ Big Bullish Candle (Marubozu)
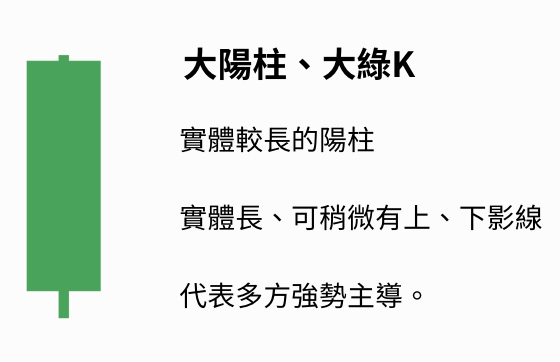
Characteristics: Green, long body, short or non-existent wicks.
Meaning: Strong bullish momentum, usually representing a continuation of the trend.
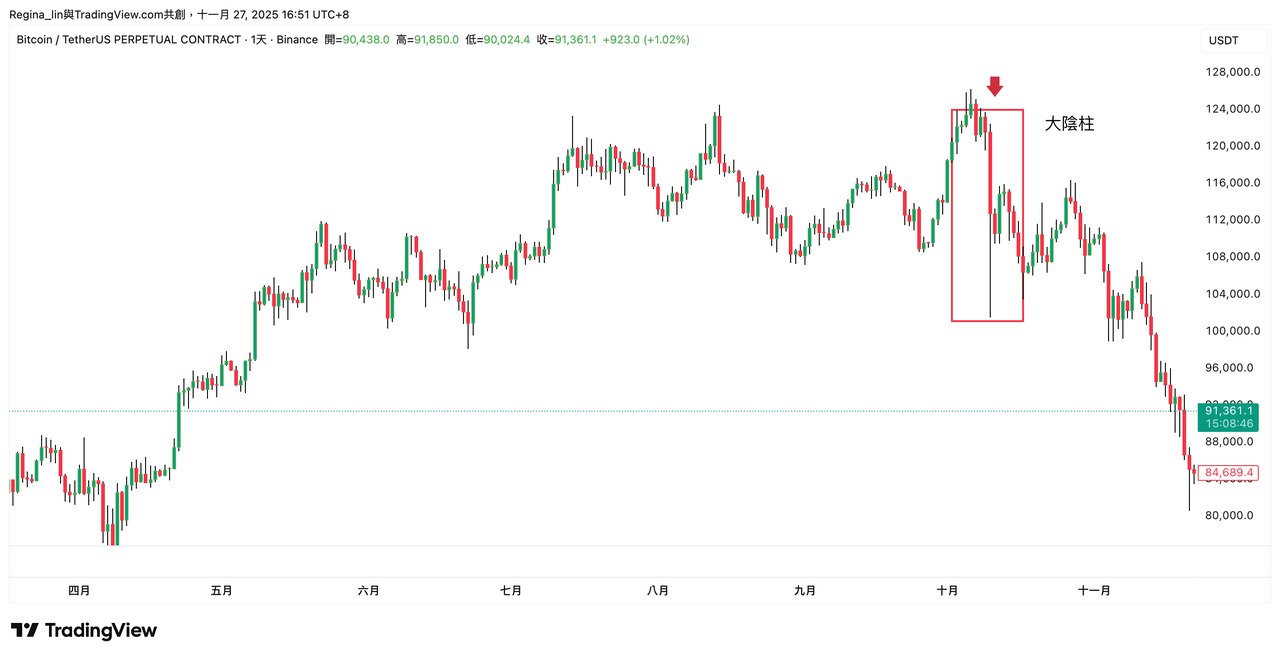
2️⃣ Big Bearish Candle (Marubozu)
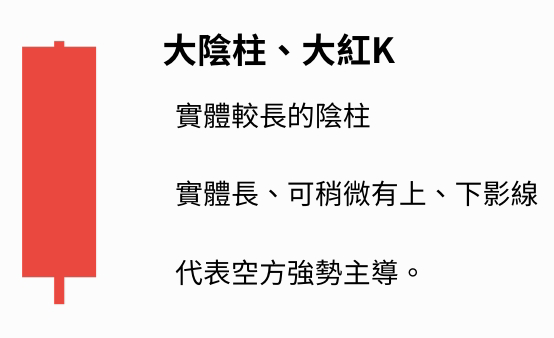
Characteristics: Red, long body, short wicks.
Meaning: Strong bearish momentum, the price action may accelerate downward.
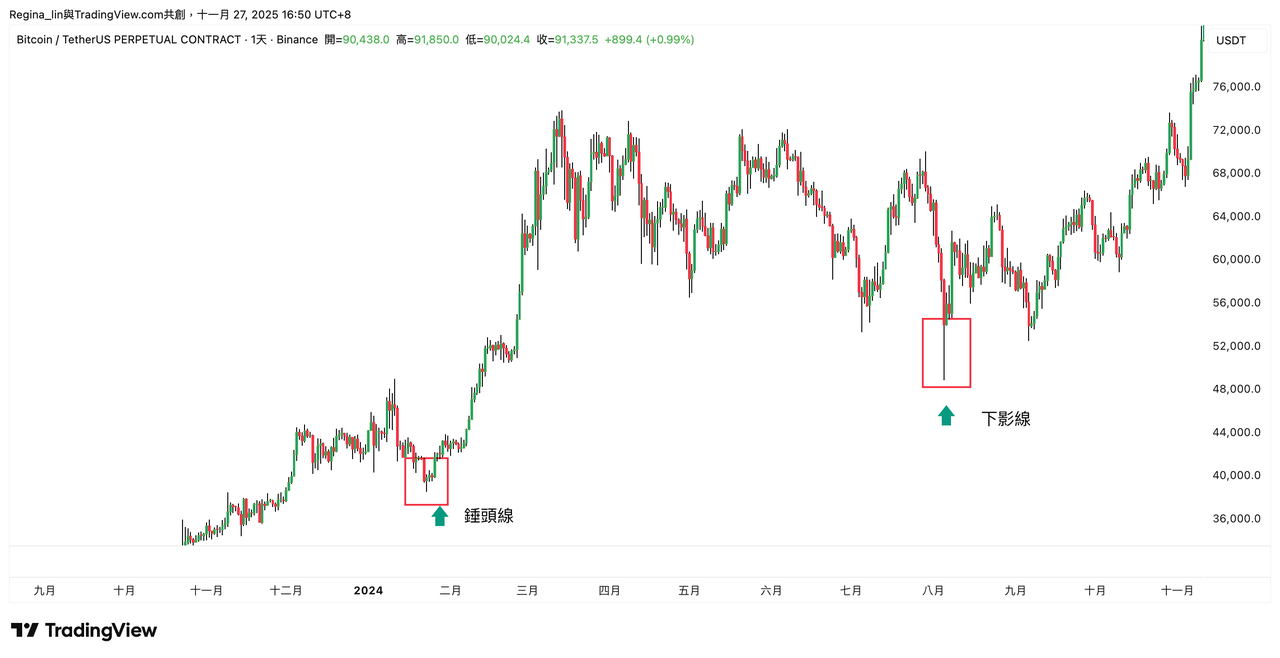
3️⃣ Hammer
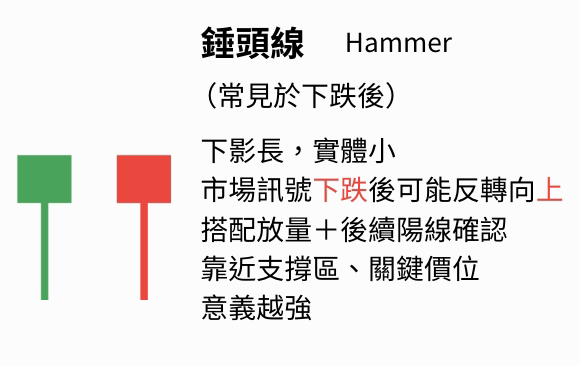
Appears at the end of a downtrend. It has a long lower wick and a small body, looking like a hammer. It often represents a signal that the decline is stopping.
👉 Indicates: Bears are struggling to push lower, and bulls are starting to take over.
4️⃣ Shooting Star
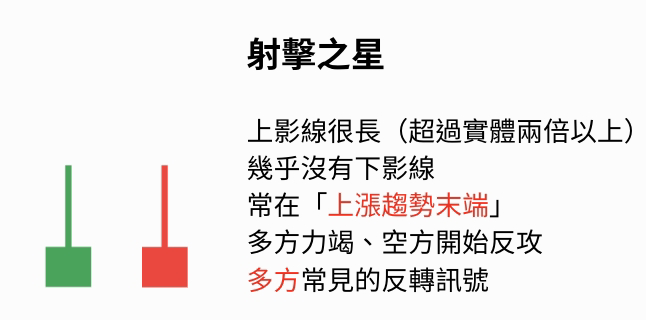
Often appears at high levels. It has a long upper wick and a small body, looking like an inverted hammer.
👉 Indicates: Bulls cannot push higher and are suppressed by selling pressure; there is a risk of a reversal.
5️⃣ Doji
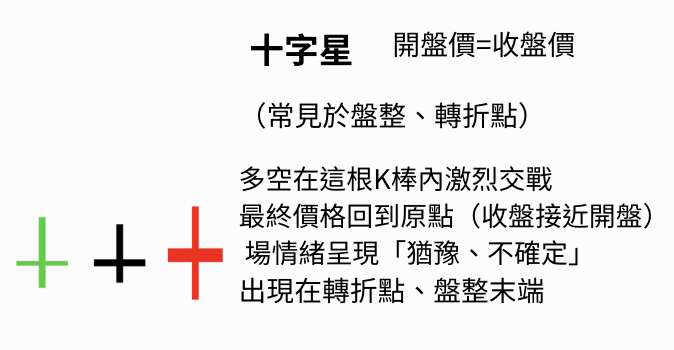
Characteristics: Opening and closing prices are almost identical.
Meaning: A stalemate between bulls and bears, often appearing before a key pivot or turning point.
4. What is the True Meaning of Candlesticks?
Candlesticks are not used to predict the future; rather, we read market sentiment through candlestick reactions at key price levels. This allows us to respond differently based on various candlestick reactions, for example:
- In a resistance zone or at a key psychological round number level.
- If a Shooting Star pattern appears, it indicates a potential reversal risk for bulls. At this point, we can observe if the next candle breaks below the low of the Shooting Star to look for a short entry.
- If a Big Bullish Candle appears, it indicates the bullish trend may continue, and we can enter a breakout long trade.
5. Candlestick + Trend = Win Rate
Looking at candlesticks alone is not enough; we need to pair them with the current trend.
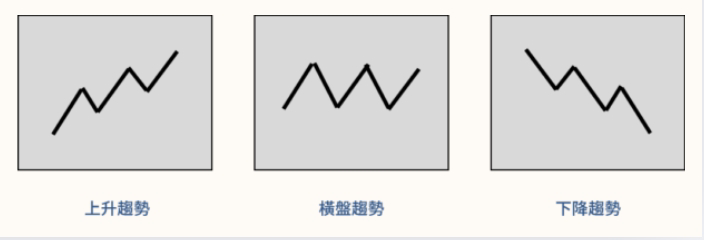
The overall market can generally be divided into three trends, which are the foundation of all technical analysis and trading strategies:
1. Uptrend
Prices move higher, with higher highs and higher lows.
2. Downtrend
Prices move lower, with lower highs and lower lows.
3. Consolidation (Range)
Price fluctuates back and forth between two price levels without a clear direction.
🔸 In an Uptrend
1. A hammer or long lower wick during a pullback is often a trend-following buy point.
2. If a Big Bearish Candle appears and completely engulfs the previous rally, the trend may be reversing.
🔸 In a Downtrend
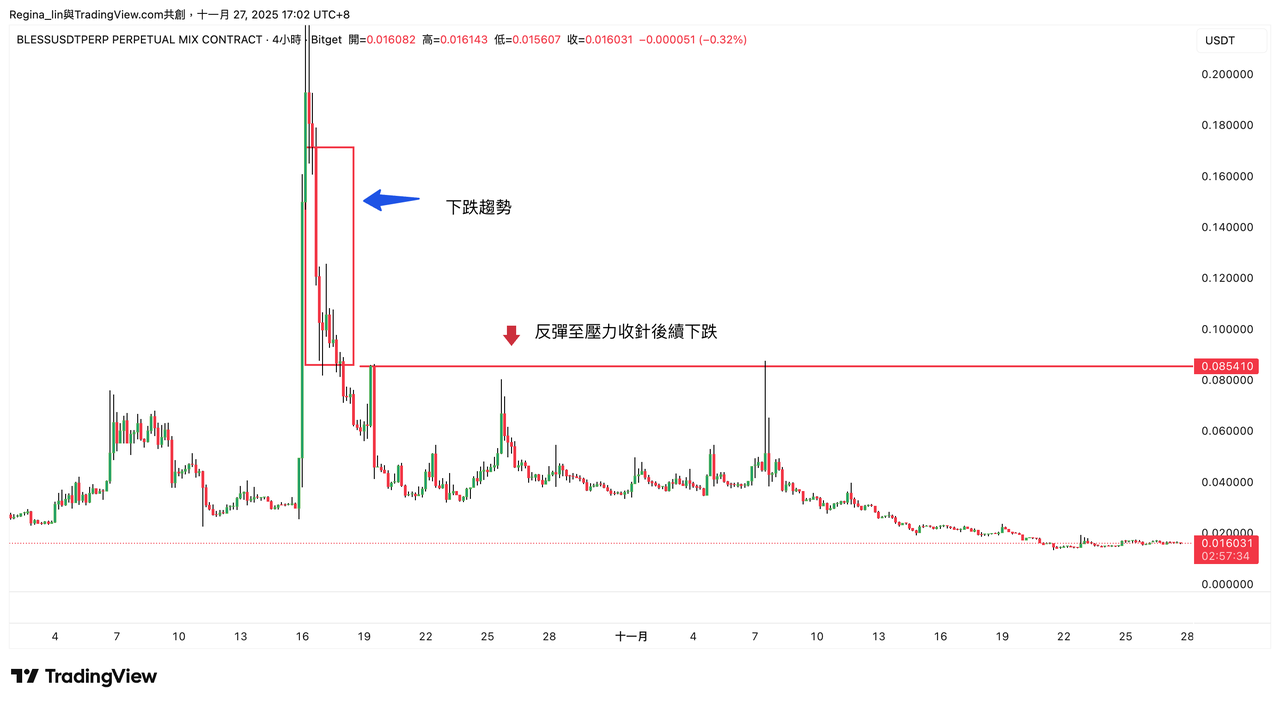
A long upper wick during a bounce is often the point where the bears strike again.
In the next chapter, we will begin to combine Candlesticks + Volume + Trend so that you can actually apply them, rather than just memorizing terms.