As of February 2026, the cryptocurrency market finds itself in the grip of "Extreme Fear," with the Fear and Greed Index plummeting to single digits (as low as 5-9) after Bitcoin crashed from over $126,000 in October 2025 to below $70,000 in early February.
During this dramatic sell-off, funding rates, one of the most important yet misunderstood mechanisms in perpetual futures trading, have flipped negative across many trading pairs, signalling a profound shift in market sentiment and creating both opportunities and risks for traders on LBank's platform and other exchanges, too.
Understanding funding rates is not optional for serious futures traders. These periodic payments can make the difference between profitable and losing trades, reveal hidden market psychology, and provide actionable signals for entry and exit timing. This comprehensive guide will demystify funding rates, show you how to interpret them in the current 2026 market environment, and teach you specific strategies to profit from these dynamics.
The Fundamental Purpose: Keeping Perpetual Contracts Anchored
Before diving into funding rates specifically, it's crucial to understand the unique challenge perpetual contracts solve. Unlike traditional quarterly futures that have expiration dates when prices naturally converge to spot, perpetual contracts never expire. This creates a problem: what prevents the perpetual price from drifting far away from the actual spot market price?
The answer is the funding rate mechanism, an elegant solution that keeps perpetual contract prices tethered to spot prices through economic incentives rather than forced settlement. When the perpetual contract price diverges from spot, funding rates automatically adjust to encourage traders to bring prices back into alignment.
Critical Distinction: Funding rates are not fees paid to the exchange. They are peer-to-peer payments between traders—specifically between those holding long positions and those holding short positions. LBank and other exchanges facilitate these transfers; they don't keep any portion of funding payments. This peer-to-peer structure creates a self-correcting mechanism that works 24/7 to maintain price alignment.
How LBank's Funding Rate Schedule Works
On LBank's perpetual futures platform, funding rate exchanges occur every 8 hours at fixed times: 00:00 UTC, 08:00 UTC, and 16:00 UTC. This means you'll encounter three funding events per day if you hold positions overnight.
The timing is critical to understand: funding is only charged or credited if you hold a position at the exact moment of the timestamp. If you close your position even one minute before the funding time and reopen it one minute after, you completely avoid the funding payment for that interval. This creates opportunities for sophisticated traders to manage their funding costs strategically.
For example, if you're holding a long Bitcoin position and the next funding event at 16:00 UTC shows a rate of +0.05% (meaning longs pay shorts), closing your position at 15:59 UTC and reopening at 16:01 UTC saves you 0.05% of your position size. On a $100,000 leveraged position, that's $50 saved in just those few minutes.
The Formula: Interest Rate + Premium Index
Funding rates on LBank (and most exchanges) are calculated using two components:
Funding Rate = Interest Rate Component + Premium Index
The Interest Rate represents the cost of capital and is typically set as a default baseline. On most platforms, including LBank, this is standardised at approximately 0.01% per 8-hour interval (0.03% daily). This baseline reflects the theoretical cost of borrowing USDT to fund a position.
The Premium Index is the dynamic component that responds to market conditions. It measures the price gap between the perpetual contract and the underlying spot market. The formula captures how far the perpetual price is trading above or below spot: Premium Index = (Perpetual Price - Spot Index Price) / Spot Index Price.
When the perpetual trades above spot (premium), the Premium Index is positive. When it trades below spot (discount), the Premium Index is negative. This premium or discount directly reflects market sentiment—bullish traders willing to pay a premium to be long, or bearish traders willing to accept a discount to be short.
The magnitude of the Premium Index determines how strongly the funding rate pushes traders toward equilibrium. A small premium might generate a total funding rate of +0.02%, while extreme premiums during euphoric bull markets can push rates to +0.1% or even +0.3% per interval.
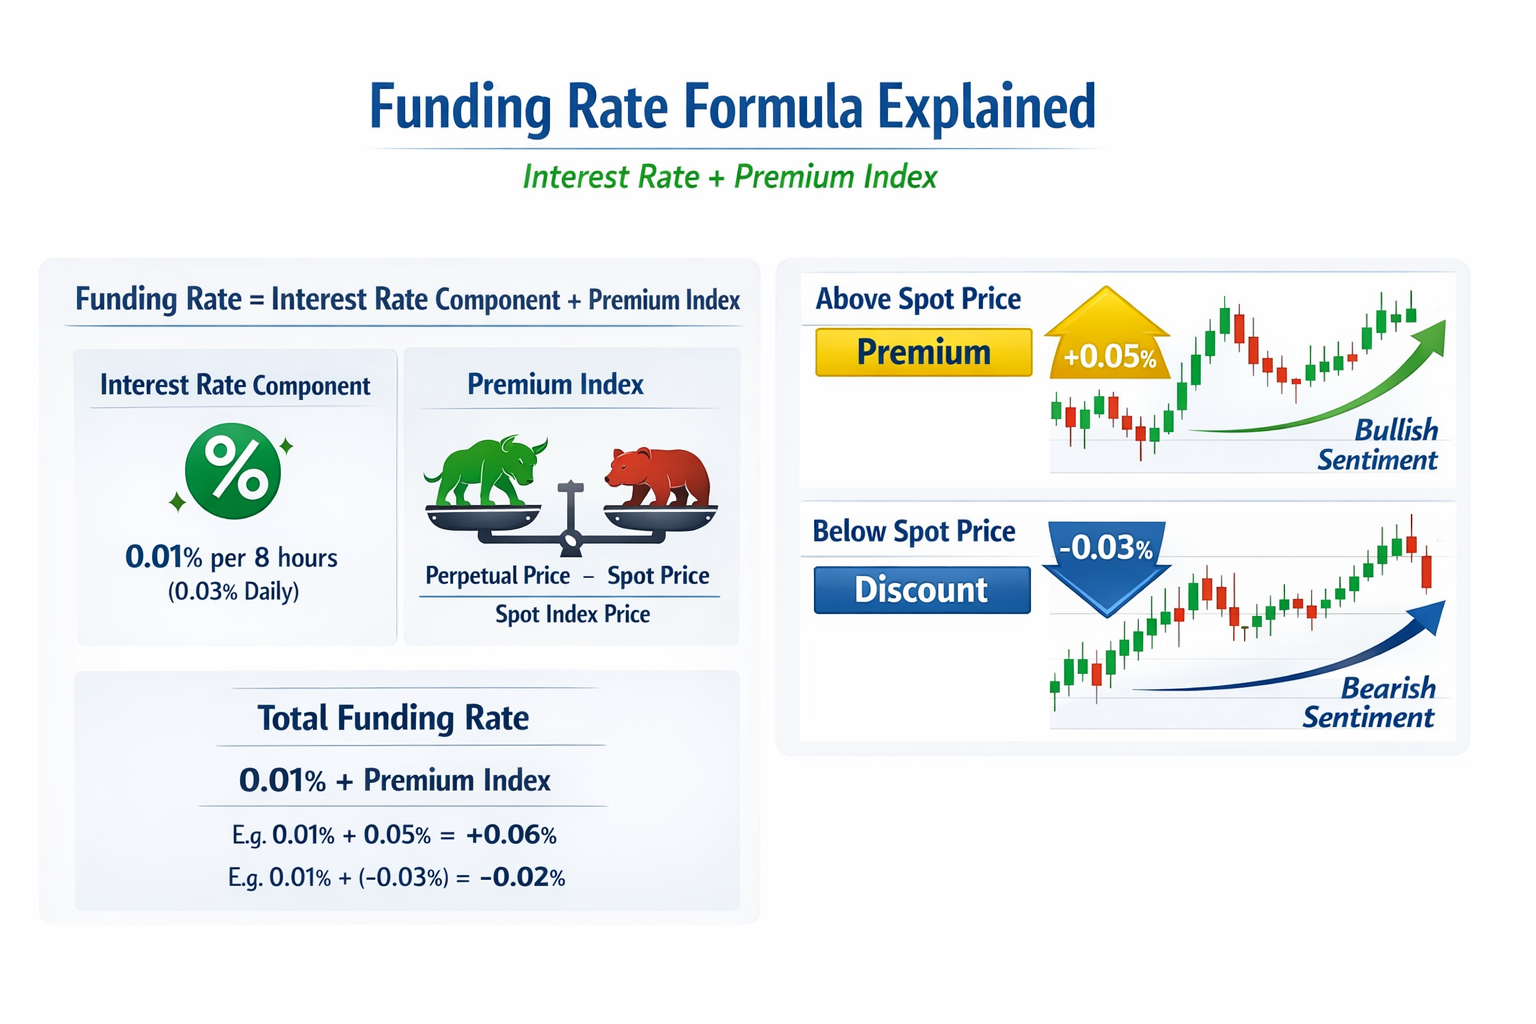
IMAGE: by Author
Interpreting Market Sentiment Through Funding Rates
Funding rates serve as a continuous sentiment gauge, revealing the market's collective positioning and conviction. Understanding what different funding rate levels signal is essential for contextualising price action.
Positive Funding: Bullish Dominance
When funding rates are positive, the perpetual contract is trading at a premium to spot, indicating that longs pay shorts. This scenario reveals several important market dynamics.
Aggressive Bulls: Traders are so eager to hold long positions that they're willing to pay shorts for the privilege. This demonstrates strong bullish conviction and expectation of further price appreciation.
Crowded Longs: High positive funding rates often indicate that long positions have become overcrowded. When everyone is already long, there are fewer new buyers left to push prices higher, creating vulnerability to reversals.
Cost of Staying Long: For long position holders, positive funding represents an ongoing cost that erodes profitability over time. A rate of +0.1% every 8 hours translates to 0.3% daily or approximately 9% monthly—a significant drag on returns.
Negative Funding: Bearish Dominance
When funding rates are negative, the perpetual trades at a discount to spot, meaning that shorts pay longs. In February 2026's market panic, we've seen this scenario play out dramatically:
Aggressive Bears: Traders are so convinced prices will fall that they're willing to pay long holders for the privilege of being short. This reflects strong bearish conviction or outright panic.
Crowded Shorts: Just as positive rates indicate overcrowded longs, negative rates signal overcrowded shorts. This creates vulnerability to short squeezes—rapid upward price moves that force shorts to cover at losses.
Income for Long Holders: During periods of negative funding, holding long positions actually generates income. You're being paid to hold your position, which can offset mark-to-market losses and make contrarian long positions more attractive.
February 2026 Context: As Bitcoin crashed from above $90,000 to below $70,000 (even briefly touching $60,000), funding rates turned deeply negative across major pairs. This indicated extreme bearish positioning and panic shorting—conditions that historically precede rebounds as shorts become overextended.
Neutral Funding: Balanced Market
When funding rates hover near the baseline 0.01% interest rate with minimal premium, it indicates:
Market Equilibrium: Neither bulls nor bears have conviction strong enough to pay for their positions. The market is balanced or waiting for a catalyst.
Sideways Price Action: Neutral funding often coincides with consolidation periods where price trades in a range without clear direction.
Calm Before the Storm: Periods of neutral funding can precede explosive moves in either direction as conviction builds and traders begin positioning aggressively.
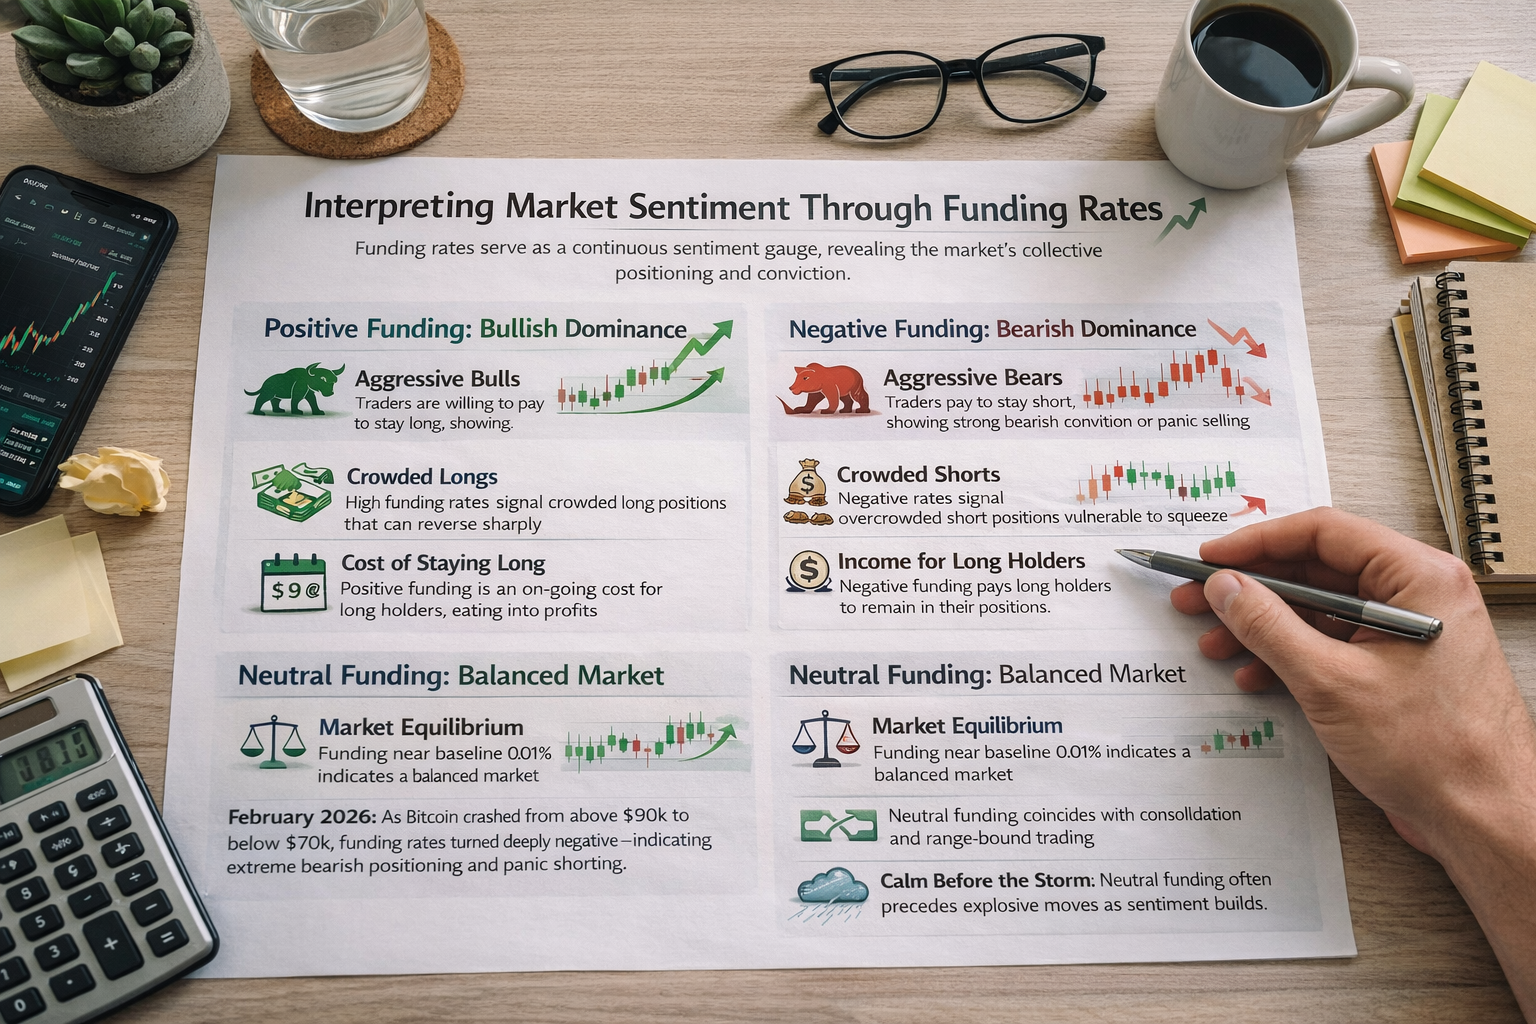
IMAGE: by Author
Extreme Readings: Signals and Trading Opportunities
While funding rates typically oscillate within a moderate range, extreme readings provide particularly actionable signals.
High Positive Rates (Above 0.05-0.10%)
Extremely high positive funding rates signal long squeeze risk. When rates reach 0.1% per interval or higher (0.3% daily, 9% monthly), several dynamics emerge:
Unsustainable Costs: Even profitable long positions become expensive to maintain. Traders begin closing longs simply to avoid funding costs, creating selling pressure.
Liquidation Cascade Risk: Highly leveraged longs paying extreme funding rates have their margin slowly depleted. As liquidation prices creep closer, cascading liquidations can trigger sharp selloffs.
Mean Reversion Opportunity: Statistically, extreme positive funding often precedes corrections or consolidations as the cost of being long becomes prohibitive and profit-taking accelerates.
Historical Example: During Bitcoin's run toward $100,000 in late 2025, funding rates exceeded +0.15% on some platforms. This wasn't sustainable, and the subsequent correction to $90,000 was partly driven by long position holders closing to avoid funding costs.
Deep Negative Rates (Below -0.05%)
Deeply negative funding rates signal short-squeeze risk and potential panic capitulation. The February 2026 market crash has demonstrated this perfectly:
Panic Shorting: When fear dominates, and funding rates plunge below -0.05% to -0.10% or lower, it indicates traders are desperately shorting even though they have to pay for the privilege.
Contrarian Buy Signal: Extreme negative funding historically marks excellent buying opportunities. When shorts are overcrowded and paying heavily to maintain positions, even modest buying pressure can trigger a violent short-squeeze rally.
February 2026 Case Study: As Bitcoin fell below $70,000, funding rates on major pairs turned deeply negative. Shorts were so crowded that when Bitcoin rebounded from $60,000 to above $70,000 within 24 hours on February 6-7, over $1 billion in short positions were liquidated in the resulting squeeze. Traders who went long during extreme negative funding captured both the price rebound and received funding payments from shorts during the bounce.
Actionable Trading Strategies Using Funding Rates
Understanding funding rates theoretically is one thing; profiting from them requires specific, actionable strategies.
Strategy 1: Timing the 8-Hour Interval
The most straightforward funding rate strategy exploits the payment timing. Since funding is only exchanged at the exact timestamp (00:00, 08:00, 16:00 UTC), you can avoid payments by closing positions minutes before funding and reopening afterwards.
When to Use: This strategy works best when funding rates are high (positive or negative), and you want to maintain directional exposure without paying the cost.
Execution: Set alerts for 5 minutes before each funding time. If you're holding a long position with +0.08% funding rate, close at XX:55 and reopen at XX:05. You save 0.08% of your position value while maintaining the same exposure.
Limitations: This strategy incurs trading fees twice (close + reopen), so you need funding rates high enough to justify the transaction costs. On LBank with 0.05% taker fees, you need funding rates above ~0.10% for this to be worthwhile.
Risk: In volatile markets, the price can move significantly in those 10 minutes. You might close at $88,000 and find the price has moved to $89,000 when you try to reopen, negating your funding savings.
Strategy 2: Funding Rate Arbitrage (Cash and Carry)
This market-neutral strategy profits from funding payments without taking directional price risk. It's one of the few "risk-free" strategies in crypto trading.
Setup: When perpetual contracts have high positive funding rates:
- Buy the cryptocurrency in the spot market
- Simultaneously, short the perpetual contract in equal size
- Collect positive funding payments every 8 hours as shorts receive from longs
- The long spot and short perpetual positions offset each other's price risk
Example: Bitcoin is at $88,000 spot and $88,500 on perpetuals, with funding at +0.10% per interval.
- Buy 1 BTC on LBank spot: $88,000
- Short 1 BTC on perpetuals: $88,500
- Every 8 hours, receive 0.10% × $88,500 = $88.50 in funding
- Daily income: $265.50 (0.3%)
- Monthly annualised: ~9% risk-free return
Requirements: Sufficient capital to hold both spot and short perpetual positions. Careful position sizing to ensure your short doesn't get liquidated if price rises sharply (though your spot position gains offset this).
2026 Application: During periods when funding normalises and turns positive again after the current extreme fear subsides, this strategy becomes viable. Historical patterns suggest funding turns positive during recovery rallies, creating arbitrage opportunities.
Strategy 3: The Basis Trade with Quarterly Futures
This advanced strategy exploits the difference between perpetual contracts (with funding) and quarterly futures (without funding) to optimise long-term position costs.
Concept: LBank offers both perpetual and quarterly futures contracts. Perpetuals charge funding every 8 hours, while quarterly futures have no ongoing funding costs—they simply converge to spot at expiration.
Long-Term Bullish Position: If you're bullish for the next 2-3 months:
- ❌ Bad: Hold perpetual long position, paying cumulative funding if rates are positive
- ✅ Better: Hold a quarterly futures long position, paying no funding
Example: You expect Bitcoin to rise from $88,000 to $100,000 over the next 3 months.
- Perpetual Route: At average funding of +0.03% per interval, you pay ~0.09% daily = ~8.1% over 90 days
- Quarterly Route: March quarterly contract might trade at a 3% premium to spot, but you pay this once upfront with no ongoing costs
If the quarterly premium is less than the cumulative expected funding, quarterly futures are more cost-effective for long-term positions.
Hedging Application: If you hold perpetual longs but funding turns highly positive, roll them into quarterly futures to eliminate funding costs while maintaining bullish exposure.
Strategy 4: Contrarian Positioning at Extreme Funding
This strategy exploits the mean reversion tendency when funding rates reach extremes.
Setup for Long Squeeze: When funding rates exceed +0.10% (longs paying shorts heavily):
- Wait for Confirmation: Don't short immediately; wait for price to show weakness
- Open Short Position: You profit from both the likely price decline AND receive funding payments from overcrowded longs
- Exit on Funding Normalisation: Close when funding returns to neutral levels
Setup for Short Squeeze (February 2026 Opportunity): When funding rates fall below -0.05% (shorts paying longs):
- Enter Long Position: Buy when fear is extreme, and shorts are overcrowded
- Collect Funding: Receive payments from shorts every 8 hours while waiting for the squeeze
- Profit from Squeeze: When shorts begin covering, price rockets upward
- Exit on Funding Flip: Close when funding returns to neutral or turns positive
February 2026 Trade Example: On February 5-6, as Bitcoin crashed to $60,000 and funding rates plunged to -0.08% on some pairs:
- Entry: Long BTC perpetual at $62,000 with 10x leverage
- Funding Income: Receiving ~0.08% every 8 hours = 0.24% daily from shorts
- Price Recovery: Bitcoin bounced to $70,000+ within 48 hours (+12.9% move)
- Leveraged Gain: 10x leverage on 12.9% = 129% return
- Plus Funding: Additional ~0.5% from 48 hours of funding income
- Total: ~130% return in 2 days by going long during extreme fear
Risk Management: The Hidden Danger of Funding Rates
While funding rates create opportunities, they also pose serious risks that traders must manage carefully.
Margin Erosion from Funding
The Insidious Threat: Funding payments don't just reduce your profits—they reduce your margin balance. This brings your liquidation price closer, even if the market price doesn't move.
Example: You open a $100,000 Bitcoin long position (10x leverage) with $10,000 margin. Your liquidation price is calculated at entry. Over the next week, you pay $300 in funding costs.
Your margin is now $9,700, and your liquidation price has moved closer to the current market price, even though the price hasn't changed. If volatility then spikes downward, you're more likely to be liquidated than when you entered the trade.
Mitigation: Factor funding costs into your position sizing. If you expect to pay 0.3% daily in funding, calculate how many days you can sustain this before approaching liquidation, and either reduce position size or plan earlier exits.
The Leverage Multiplier Effect
Critical Understanding: Funding costs are calculated on your nominal position value, not your margin. This means leverage multiplies your funding costs just as it multiplies your price exposure.
Example:
- Position: $100,000 Bitcoin long (100x leverage)
- Margin: $1,000
- Funding Rate: +0.10% per interval
- Funding Cost: 0.10% × $100,000 = $100 per interval, or $300 per day
You're paying 30% of your margin per day in funding (300/1,000 = 0.30). At this rate, your entire margin depletes in just 3-4 days, even if the price doesn't move at all. This is why extreme leverage becomes untenable during high funding periods.
The 2026 Lesson: Many traders who were liquidated during Bitcoin's crash from $90,000 to $60,000 weren't liquidated solely by price movement. High leverage combined with positive funding rates eroded their margins over days, bringing liquidation prices closer until a moderate price drop triggered their liquidation.
Safe Practice: When funding rates are high, reduce leverage proportionally. If funding is double the normal rate, cut your leverage in half to maintain similar total risk.
Unexpected Funding Flips
The Scenario: You enter a position based on current funding dynamics, but funding flips before your exit.
Example: You short Bitcoin when funding is +0.08% (receiving payments). Your thesis plays out, and price falls, but in the panic, funding flips to -0.05% (now you're paying). What was supposed to be a profitable short with funding income becomes a position bleeding funding costs.
Mitigation: Always have a maximum holding period in mind. Don't assume funding will remain favourable for the duration of your trade. Set alerts for funding rate changes and be prepared to close if your funding thesis is invalidated.
February 2026 Market Context: A Case Study in Funding Dynamics
The dramatic market movements of early February 2026 provide a real-time case study in how funding rates reflect and influence market psychology.
The Setup: After Bitcoin reached $126,000 in October 2025, a slow deterioration began. By late January 2026, BTC had declined to the $90,000-$95,000 range, with funding rates moderately positive as retail traders remained optimistic.
The Crash: Between February 1 and 6, multiple factors converged:
- Geopolitical tensions (U.S.-Iran conflict escalation)
- Tech stock selloff (Microsoft down 10%, triggering crypto correlation)
- Macro concerns about interest rates staying "higher for longer"
- Kevin Warsh's nomination as Fed Chair is creating uncertainty
Bitcoin plunged from $90,000 to briefly touch $60,000, a 33% drop in days. Over $2.7 billion in positions were liquidated, with long positions accounting for the majority.
Funding Rate Behaviour: As panic intensified, funding rates flipped from moderately positive to deeply negative:
- February 1: +0.02% (longs paying shorts moderately)
- February 3: -0.03% (shorts starting to dominate)
- February 5-6: -0.08% to -0.10% (extreme short overcrowding)
The Signal: This funding collapse to extreme negative levels signalled capitulation and overcrowded shorts. Experienced traders recognised this as a potential bottom signal.
The Squeeze: On February 6-7, Bitcoin staged a violent rebound from $60,000 to above $70,000 in just 24-36 hours. This 16%+ rally was amplified by short liquidations as overcrowded shorts were forced to cover. Over $1 billion in short positions were liquidated during this squeeze.
The Lesson: Traders who monitored funding rates saw the extreme negative readings as a contrarian buy signal. Going long at $62,000-$65,000 when everyone else was panicking (and paying to be short) proved highly profitable both from the price rebound and the funding income received from shorts.
Current State (February 9, 2026): As Bitcoin stabilises around $69,000-$70,000, funding rates have normalised somewhat to -0.01% to +0.01%, suggesting the initial panic has subsided, but conviction remains weak. The Fear and Greed Index at 9 (Extreme Fear) confirms that while the acute selling pressure has eased, market sentiment remains fragile.
Tools and Resources for Monitoring Funding Rates
Successful funding rate trading requires access to real-time data and historical context.
LBank Platform Resources
Funding Rate History: LBank provides historical funding rate data for all perpetual contracts. Access this through your trading interface under each contract's specifications. Studying historical patterns helps you understand what "normal" vs. "extreme" looks like for each trading pair.
Real-Time Display: Current funding rates and time until next funding event are displayed prominently on each perpetual contract's trading page. LBank shows both the current rate and the countdown to the next payment.
Futures Calculator: LBank's futures calculator allows you to input your position size, leverage, entry price, and expected funding rate to project total costs over your intended holding period. This is essential for planning longer-term positions.
Fee Structure Documentation: Review LBank's comprehensive futures fee structure documentation to understand how funding costs interact with trading fees. This helps you calculate total position costs accurately.
External Monitoring Tools
CoinGlass: Provides aggregated funding rates across multiple exchanges, allowing you to compare rates and identify arbitrage opportunities between platforms.
Glassnode/Santiment: These analytics platforms track funding rates as a sentiment indicator alongside other on-chain metrics, helping you contextualise funding within broader market conditions.
TradingView: Many traders use TradingView to chart funding rates alongside price action, looking for divergences or extreme readings that signal reversal opportunities.
Market Condition Quick Reference
To help you quickly assess current market conditions and adapt your strategy, use this reference table:
Market Condition | Funding Rate | Who Pays? | Sentiment | Trading Implication |
|---|
Bullish (Contango) | Positive (+0.02% to +0.10%) | Longs pay Shorts | Optimism; Long-crowded | Consider taking profits; Shorts receive income; Watch for a long squeeze if extreme. |
Bearish (Backwardation) | Negative (-0.02% to -0.10%) | Shorts pay Longs | Pessimism; Short-crowded | Contrarian long opportunity; Longs receive income; Watch for short squeeze if extreme |
Neutral | Near 0.01% (Interest only) | Minimal/Exchange | Balanced / Sideways | Low conviction; Range-trading appropriate; Wait for directional catalyst |
Extreme Bull | Above +0.10% | Longs pay heavily | Euphoria; FOMO | High risk long squeeze; Strong short opportunity; Cost unsustainable |
Extreme Bear | Below -0.05% | Shorts pay heavily | Panic; Capitulation | High probability short squeeze; Strong long opportunity; February 2026 scenario |
Conclusion: Mastering Funding Rates for 2026 and Beyond
As February 2026's extreme market volatility demonstrates, funding rates are far more than an arcane technical detail—they're a powerful tool for understanding market psychology, managing trading costs, and identifying high-probability opportunities.
The dramatic swings from positive funding during late 2025's euphoria to deeply negative funding during early 2026's panic perfectly illustrate why funding rate literacy is essential.
Traders who understood that extreme negative funding signalled capitulation and overcrowded shorts were able to profit from both the price rebound and the funding income, while those who ignored funding rates either paid high costs on their positions or missed the contrarian opportunity entirely.
Key Takeaways for LBank Traders:
- Funding is Peer-to-Peer: Remember that LBank doesn't keep funding payments—they're transferred between traders. This creates genuine economic incentives that drive price behaviour.
- Monitor the Schedule: With funding events at 00:00, 08:00, and 16:00 UTC, always be aware of the next funding time and the current rate. Set alerts if holding positions near funding times.
- Leverage Amplifies Costs: Your funding costs are calculated on nominal position value, not margin. A 100x leveraged position pays 100x the funding rate relative to your margin. Adjust leverage based on the funding environment.
- Extreme Rates Signal Opportunities: Funding above +0.10% or below -0.05% historically precedes reversals. These extremes create both risk (for those on the wrong side) and opportunity (for contrarians).
- Use All Resources: Consult LBank's Funding Rate History, Futures Calculator, and Fee Structure documentation before opening positions. Knowledge of expected costs transforms you from a gambler into a systematic trader.
- Consider Quarterly Alternatives: For longer-term positions during high funding periods, LBank's quarterly futures eliminate ongoing funding costs. Compare the quarterly premium to the expected cumulative funding to choose the most cost-effective instrument.
As cryptocurrency markets continue to mature and evolve through 2026, funding rates will remain a critical mechanism for price discovery and an essential tool for informed traders. Whether you're seeking to minimise costs on directional positions, exploit arbitrage opportunities, or identify contrarian setups during market extremes, understanding funding rates gives you a significant edge.
The current "Extreme Fear" environment, with Bitcoin recovering from the $60,000 lows but still down over 45% from October highs, creates fertile ground for funding-aware strategies. As shorts eventually cover and fear subsides, funding rates will normalise and potentially flip positive during the recovery rally. Traders who master funding rate dynamics now will be positioned to profit from both sides of this transition.
Start incorporating funding rate analysis into your pre-trade checklist on LBank today. Check the current rate, review historical patterns, calculate expected costs over your intended holding period, and consider whether the funding environment favours your strategy. This disciplined approach, combined with sound risk management and technical analysis, will elevate your trading from reactive to strategic—and your results from inconsistent to sustainably profitable.