Pinpoint Market "Reversal Points"! Master Fibonacci Retracement to Find Your Golden Entry and Exit Levels

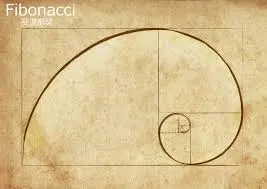
The Fibonacci sequence refers to a series of numbers: 0, 1, 1, 2, 3, 5, 8, 13, 21, 34, 55, 89... Starting from the third term, each term is the sum of the two preceding terms. In the history of mathematics, after the European Dark Ages, the first influential mathematician was Fibonacci (L. Fibonacci, 1170–1250). In his early years, he studied arithmetic under Arabs in North Africa with his father, and later traveled around the Mediterranean countries. After returning to Italy, he wrote the "Book of Calculation," also translated as the "Book of Abacus.
Introduction to Fibonacci Retracements
"Fibonacci trading" refers to a technical analysis method based on the Fibonacci sequence and the Golden Ratio, which involves certain percentages of retracement. Fibonacci Retracements can be used to identify support and resistance levels in advance.
It is often applied in financial markets to predict price support/resistance levels or to forecast trend extension targets.
The core concept involves drawing Fibonacci retracement or extension lines and using the percentage levels indicated by these lines to determine potential buy and sell points.
What is Fibonacci Retracement?
Fibonacci Retracement = Key levels where the market will retrace and test.
As long as the price action returns to 0.382 / 0.5 / 0.618, the market will make a critical decision: whether to reverse or continue the trend.
Fibonacci Retracement is a commonly used tool for identifying potential pullback and bounce locations in price action.
It calculates common market retracement zones using the "Golden Ratio" to find:
- Support points
- Resistance points
- Whether the pullback is healthy
- Whether the trend is still intact
Where Does the Magical "Golden Ratio" Come From?
This Fibonacci technical analysis method is based on a magical mathematical concept with nearly a thousand years of history – the Fibonacci sequence and the Golden Ratio.
- Fibonacci Sequence: This is a series of numbers 0, 1, 1, 2, 3, 5, 8, 13, 21..., where starting from the third term, each number is the sum of the two preceding ones.
- Golden Ratio (0.618): If you divide one number in the sequence by the next number, you will find that their ratio approaches approximately 0.618 (the inverse of the Golden Ratio).
This ratio is considered a universal pattern found in nature and is also applied in financial markets. Fibonacci retracement levels used in trading (such as 0.236, 0.382, 0.618, etc.) are important retracement levels derived from this Golden Ratio.
Understanding the Five Key "Reversal Zones"
After understanding the principles, let's look at the most commonly used retracement zones in practice, which represent different market strengths and trend statuses.
How to Draw Fibonacci Retracements? One Trick to Master It!
To use Fibonacci Retracements, you only need to remember a simple principle: draw the lines within an ongoing trend.
- Uptrend (finding support for buy points): Draw a line from the lowest point (start of the rally) to the highest point (price where the rally stopped).
- When the price retraces to 0.382 or 0.618, these levels may become your potential support levels.
- Downtrend (finding resistance for sell points): Draw a line from the highest point (start of the decline) to the lowest point (price where the decline stopped).
- When the price bounces to a certain Fibonacci level, that level may become your potential resistance level.
Important Summary: It's Not a Prediction Tool, But the Market's "Collective Rhythm"
Many people mistakenly believe that Fibonacci Retracement is a "magic formula" that can predict prices, but this understanding is not comprehensive.
Fibonacci is effective because:
- Market Consensus: Many people, including large institutions, use it, which creates collective market behavior and consensus.
- Sentiment and Structure: Whether it's Elliott Wave Theory, structural analysis, or trend continuation, market behavior ultimately generates key reactions at these levels.
Therefore, remember this most important statement: Fibonacci is not a prediction tool, but rather the market's common rhythm.
Learning it allows you to more effectively grasp the market's pulse, determine whether the current trend is a healthy pullback or if the structure is about to collapse, and thus find more precise buy and sell points.