Candlestick Charts Made Simple: A Trader's Perspective on Candlesticks (Part 2)
 LBank 官方中文2026-02-24
K Candlestick + Volume = Credibility The K candlestick (price) is the "result," while volume (trading volume) is the "underlying force." Only by combining both can you truly see the market’s direction. "Volume" = How many people are trading "Price" = Where the price is heading You can think of the market as a marketplace: Many buyers competing → Price tends to rise Many sellers competing → Price tends to fall No one cares → Price just fluctuates randomly and then stops
Why Look at Volume?
Because Volume = Strength = Consensus
Price is merely the result; volume represents the "people" driving it from behind.
If the price rises but few people are buying,
that is called "hollow."
If the price rises and many people are buying,
that is called "genuine," meaning there is market consensus.
It sounds simple, but trading is all about distinguishing between a "real pump" and a "fake pump."
The Six Most Important Price-Volume States
1. Price Increase + Volume Increase: People are truly buying (Real Pump)
Like when Elon Musk tweets about a specific coin and market consensus forms rapidly, causing buy orders to flood in directly.
Commonly occurs in:
2. Price Decrease + Volume Increase: People are truly selling (Real Dump)
Like when Trump mentions a 100% tariff increase and market consensus turns bearish, leading to rapid selling.
This means the downward move has strength and may continue to fall.
Commonly occurs in:
3. Price Increase + Volume Decrease: Rallying without conviction (Hollow Pump)
A rally stimulated by news where subsequent price pullbacks and retracements happen quickly.
Lack of follow-through buying makes it prone to reversal.
4. Price Decrease + Volume Decrease: Fewer people selling (Slowing Decline)
The price is still falling, but volume is gradually shrinking.
It represents that those who needed to sell have mostly finished,
and the remaining participants are starting to wait and see.
Market selling pressure is weakening, and it may be preparing for a bounce.
5. Price Stagnant + Volume Decrease: No one cares (Consolidation)
No one is trading, so naturally, the price does not move.
Price is stuck in a range, and trading volume is getting smaller and smaller.
Everyone is waiting for a direction.
👉 Usually, after this, volume will explode in one chosen direction.
6. Wicks + High Volume: Bulls and Bears are clashing
Long upper wick + high volume → Someone is selling aggressively at the top.
Long lower wick + high volume → Someone is buying aggressively at the bottom.
These types of candlesticks often appear during shakeouts, supply handovers, or at key levels.
Real vs. Fake Breakouts: Volume Tells the Story First
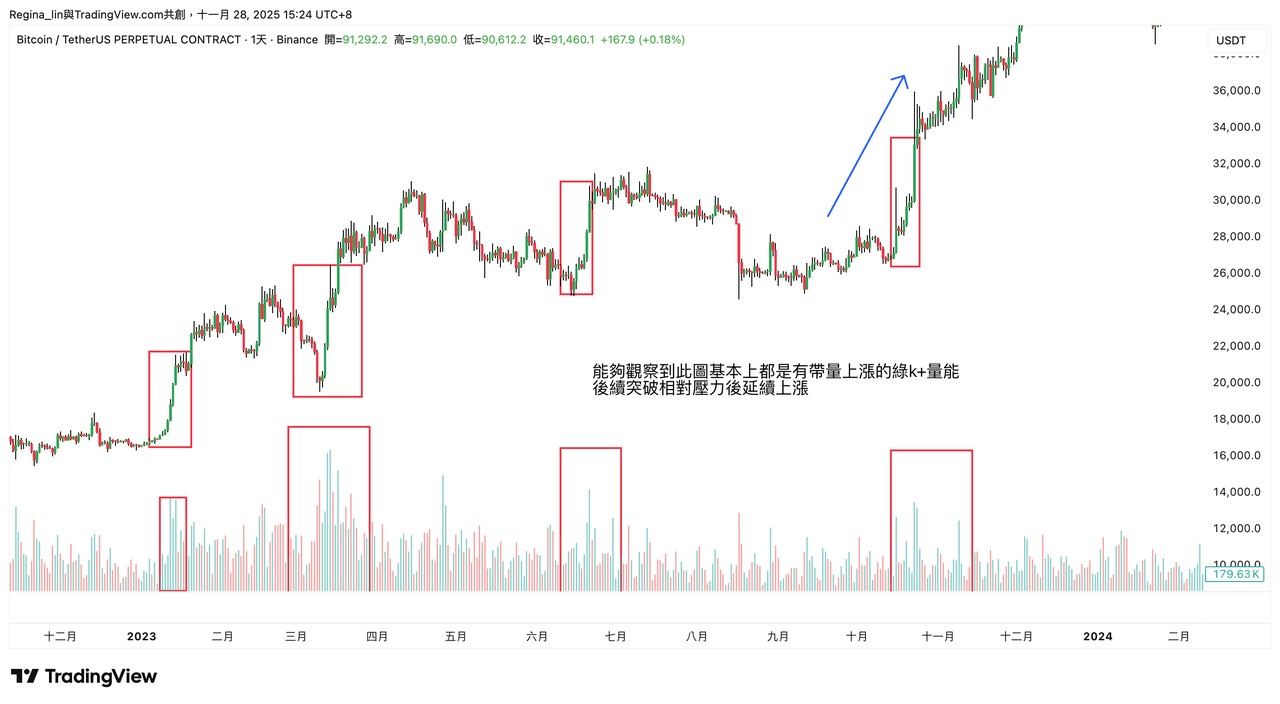
📈 Bullish Strength:
Long green candle + high volume → Market consensus is upward.
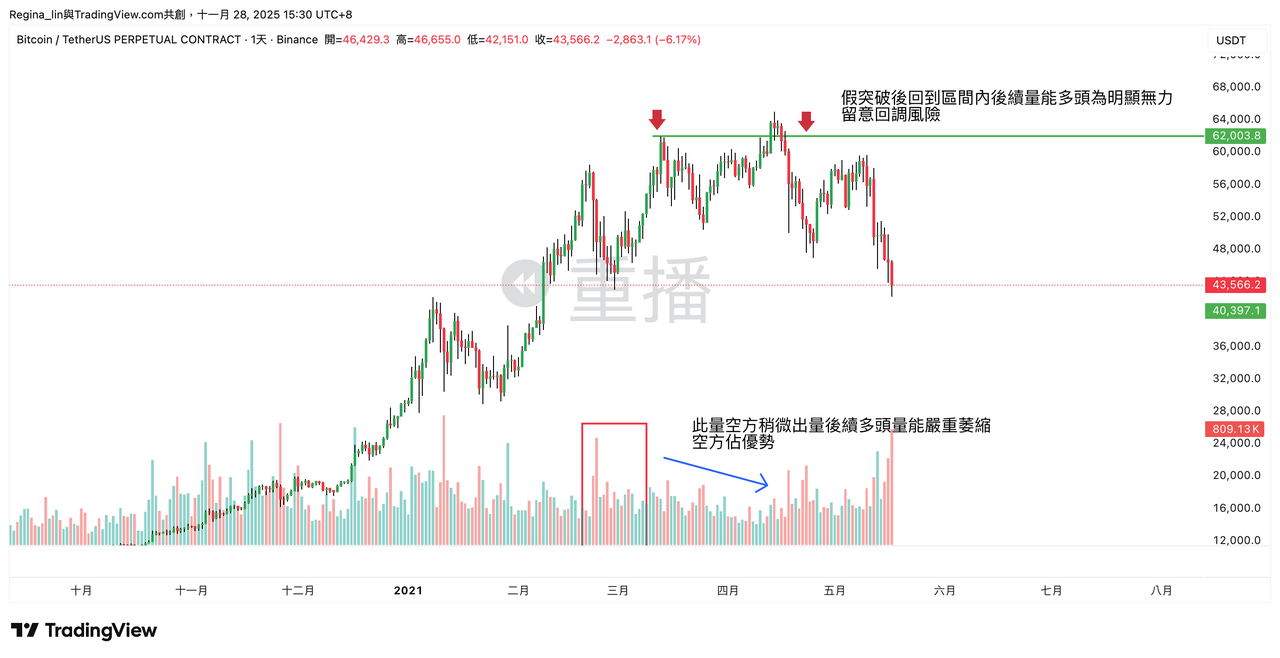
⚠️ Fake Breakout
Although the price attacks the resistance zone, it fails to hold at the close and falls back into the range. Momentum at the top is insufficient; be cautious of a retracement.
📉 Bearish Strength:
Long red candle + high volume → A genuine bearish move, not a fake drop.
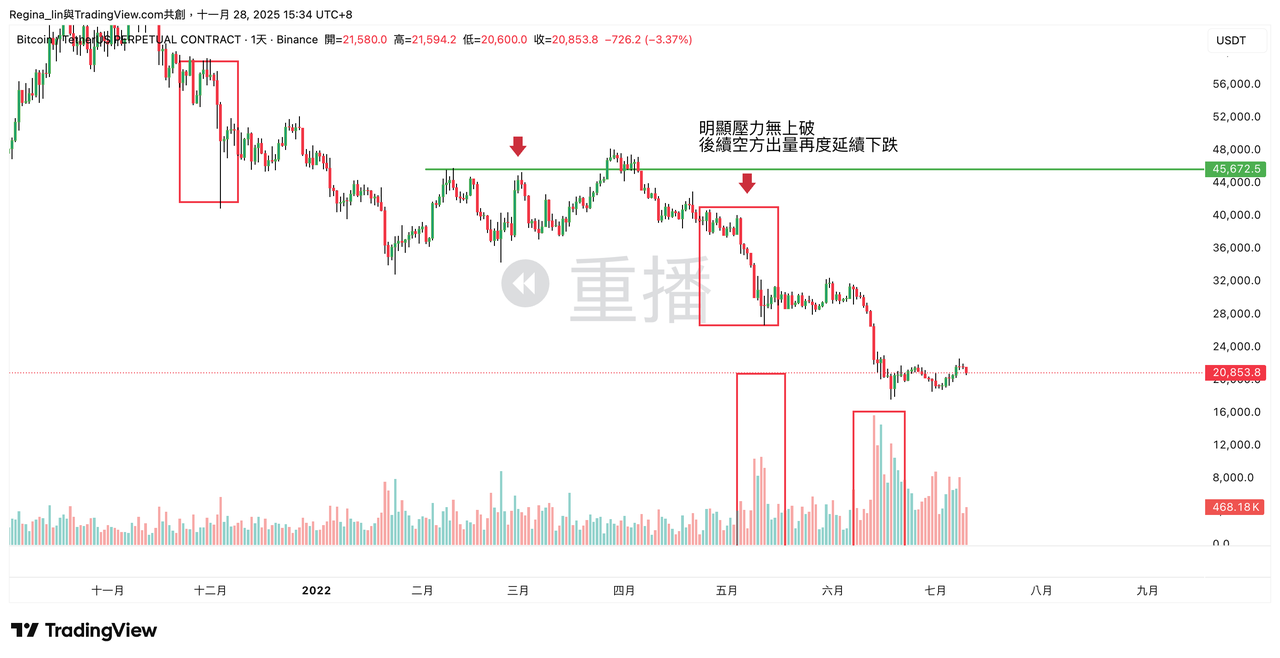
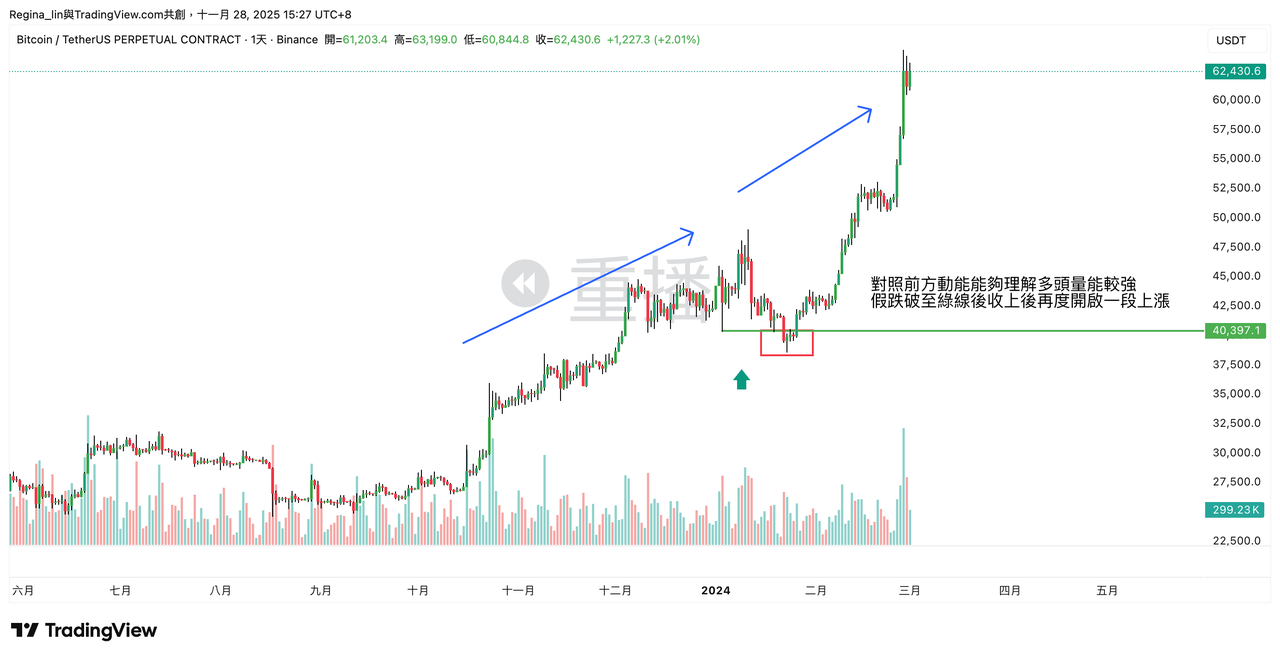
⚠️ Fake Breakdown
Although the price briefly breaks below support, it successfully closes back within the range, indicating that buying interest still exists below. Once confirmed, there is a chance for a bounce to the upper resistance.
Four Common Mistakes You Must Remember
1️⃣ Deciding direction based on a single candlestick
→ You will be shaken out many times.
2️⃣ Taking a trade without looking at the trend
→ If the trend is wrong, even the best signal is useless.
3️⃣ Looking only at candlestick patterns and ignoring volume
→ Easy to be deceived by fake breakouts.
4️⃣ Assuming every pattern will be accurate
👉 Candlesticks are not prophecies; they are auxiliary signals provided by the market to help us adjust strategies based on different market reactions, not to guess price direction.