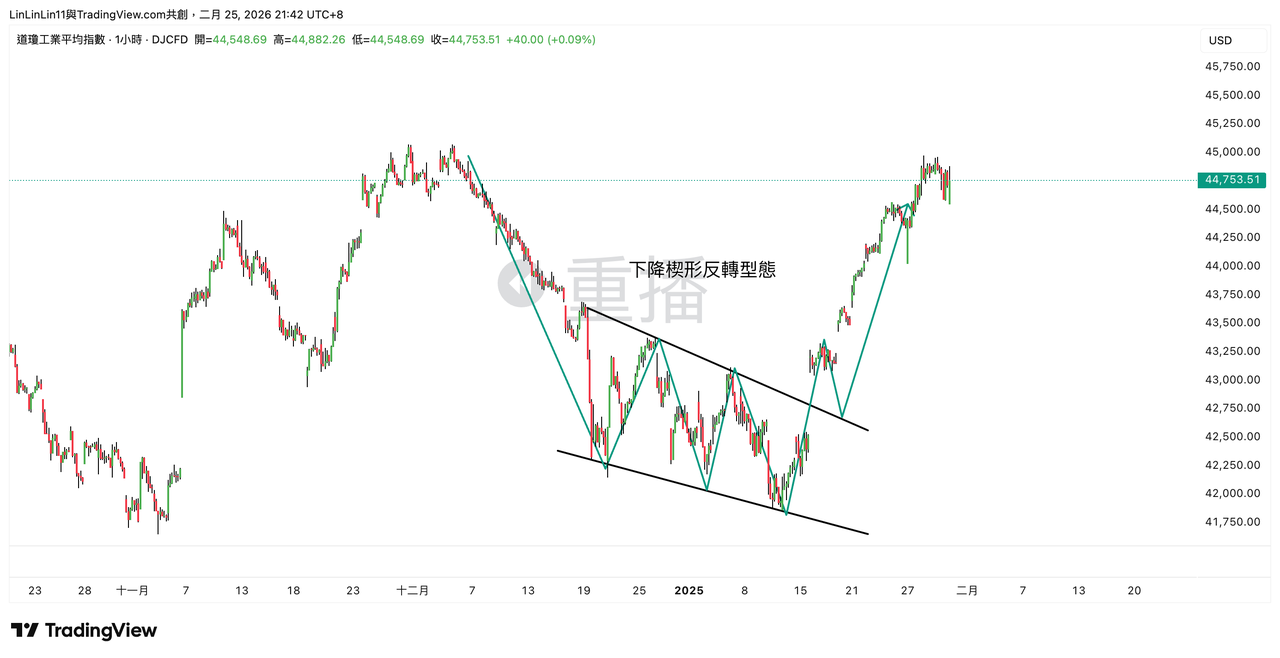
2026 Technical Analysis Guide: Learn the Four Fundamental "Patterns" in 5 Minutes

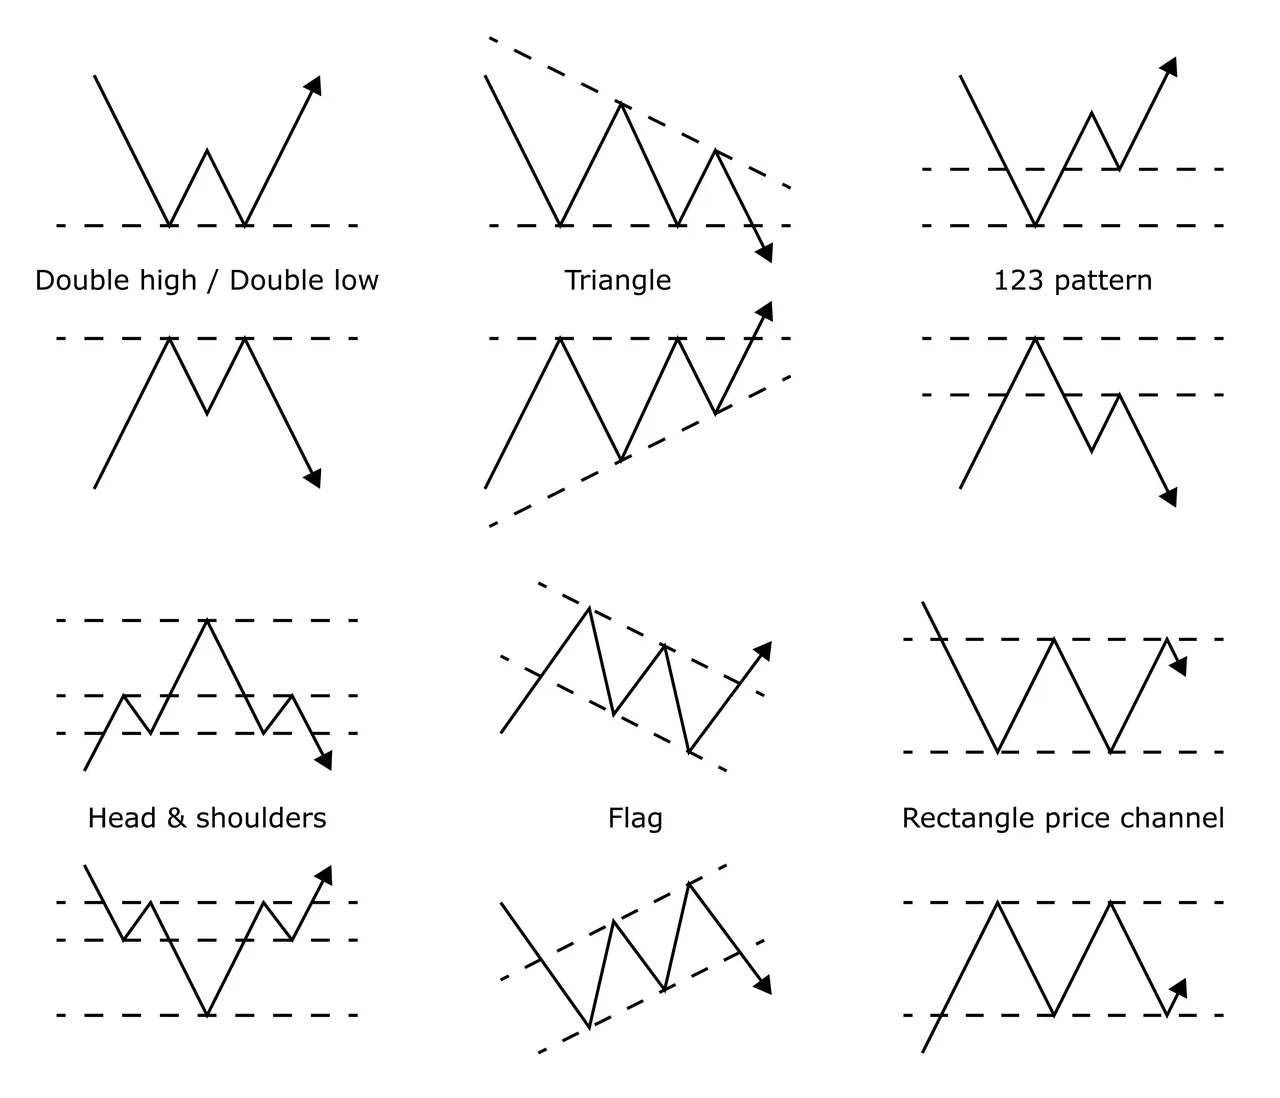
Morphology is not mysticism; it is the tangible trace of market crowd psychology, presenting the tug-of-war between bullish and bearish forces through "images." When thousands of traders act out of fear or greed, their behaviors leave recurring patterns on the price charts.
What is Chart Pattern Analysis? Spot Market Regularities in 30 Seconds
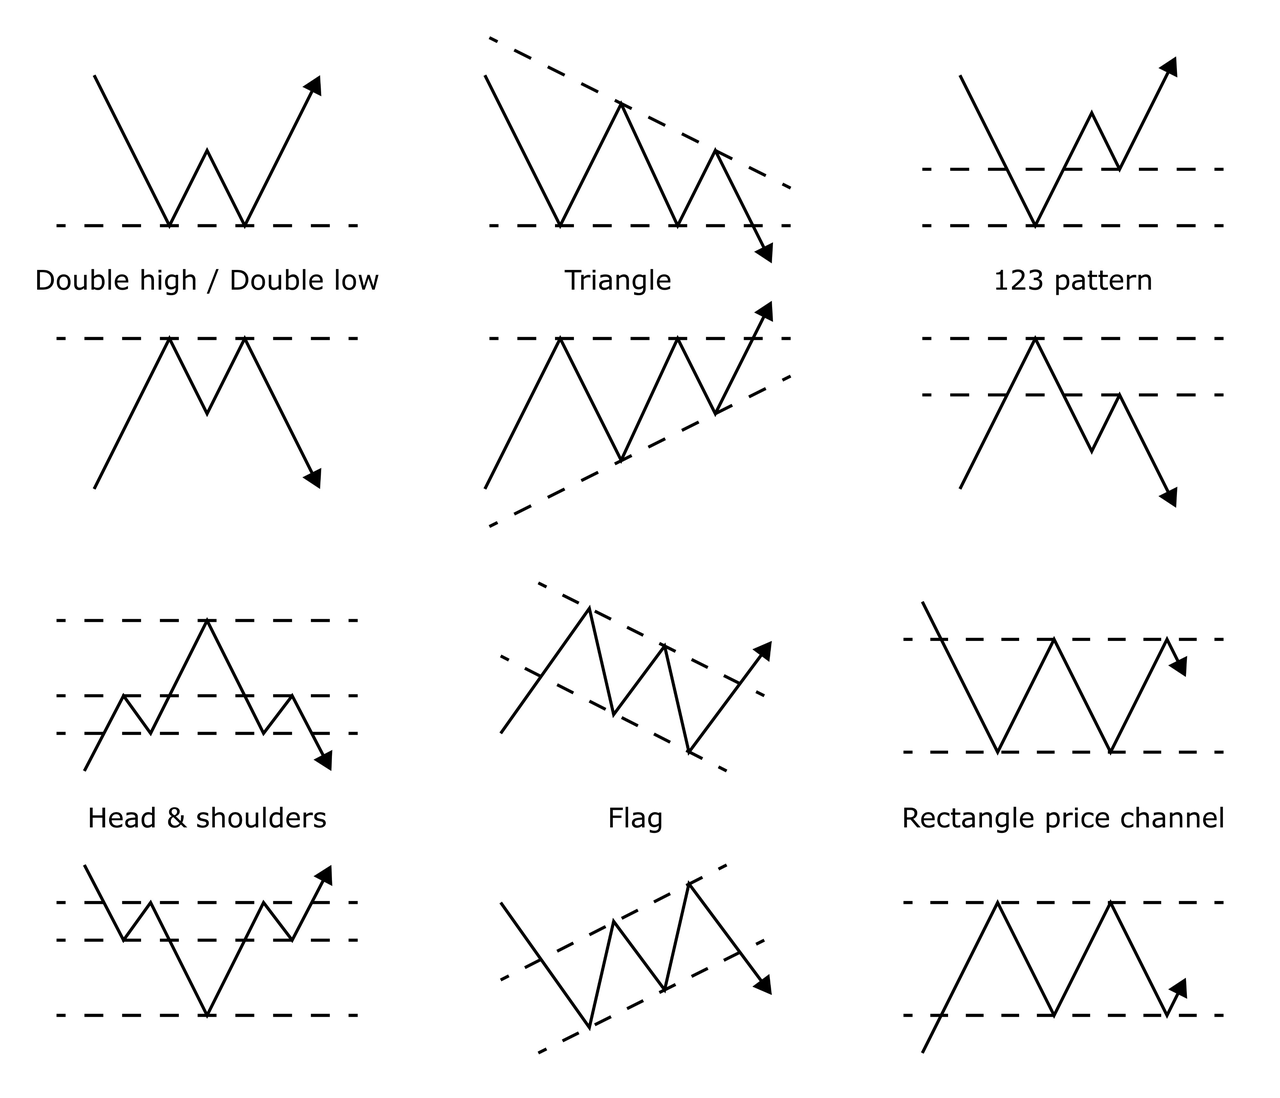
Technical analysis has three core elements: Candlesticks, Volume, and Patterns
Chart pattern analysis is a branch of technical analysis that observes market sentiment through the arrangement and combination of candlestick and price structures, offering the following values:
- Understand Market Psychology: Patterns reflect crowd behavior, helping to understand market sentiment (fear / greed)
- Identify Key Turning Points: Patterns can indicate potential trend continuation or reversal
- Improve Trading Win Rate: Provide clear basis for entry, stop-loss, and exit points
Two Classic Reversal Patterns: Signs of an Impending Trend Change
First Type: Double Bottom and Double Top (W Bottom / M Top)
Double Bottom (W Bottom)
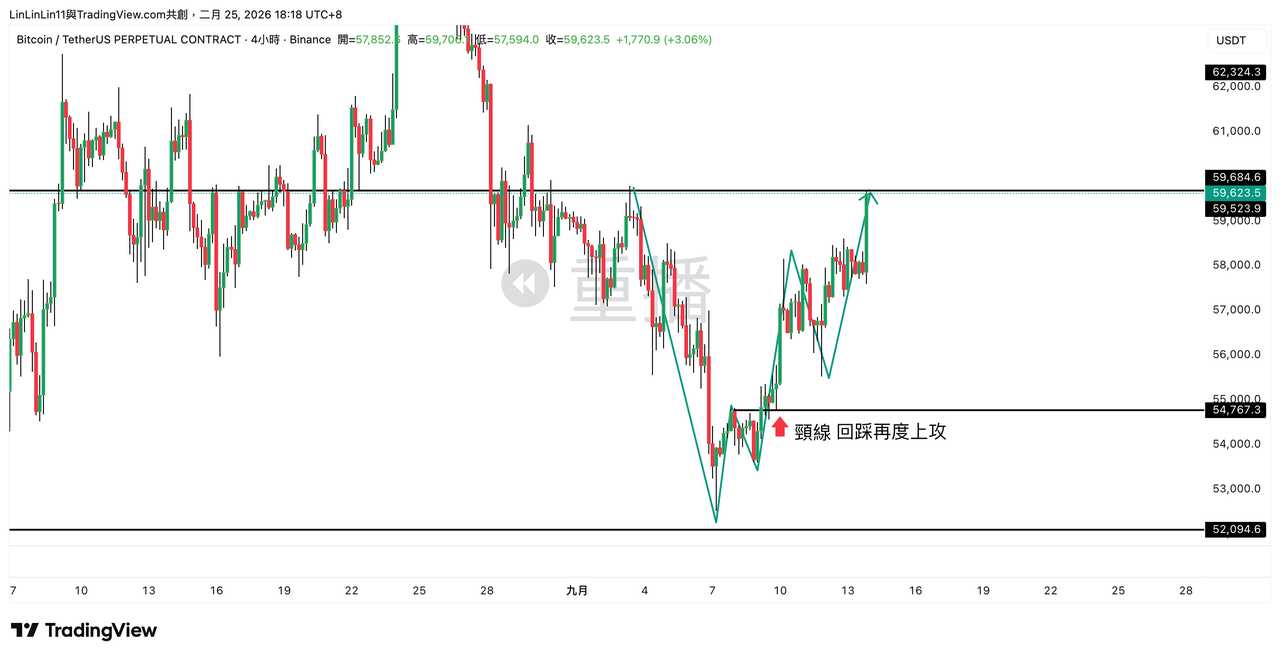
A double bottom is a bottom reversal pattern that appears at the end of a downtrend. The price forms two nearly equal lows, separated by a bounce, resembling the letter W. This indicates that bearish momentum is gradually fading, and bullish forces are preparing to take over.
Structural Characteristics:
- First Low: Price falls to a low point, then bounces due to oversold conditions or bullish absorption.
- Second Low: Price retests the low but fails to break below the previous low, forming the second bottom.
- Neckline: Connects the high point of the bounce between the two lows, typically horizontal or slightly sloping.
- Neckline Breakout: If the price effectively breaks above the neckline with increased volume, the pattern is confirmed.
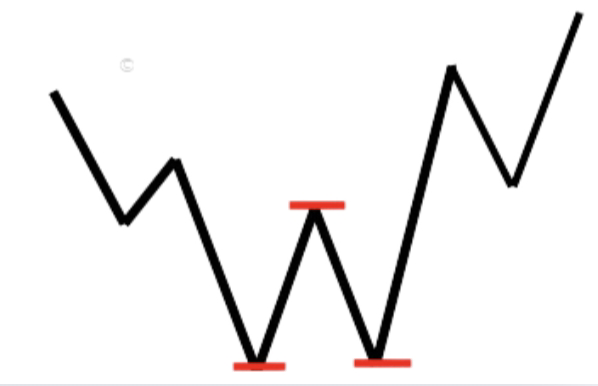
Practical Detail: The key lies in the "neckline". Before a breakout of the neckline, it's merely consolidation. A W-bottom is only officially confirmed once it breaks out with increased volume.
Double Top (M Top)
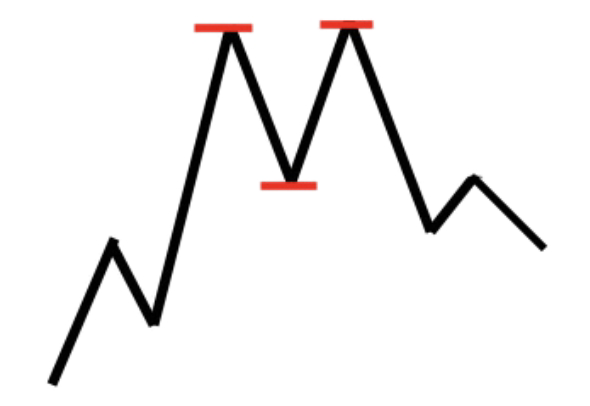
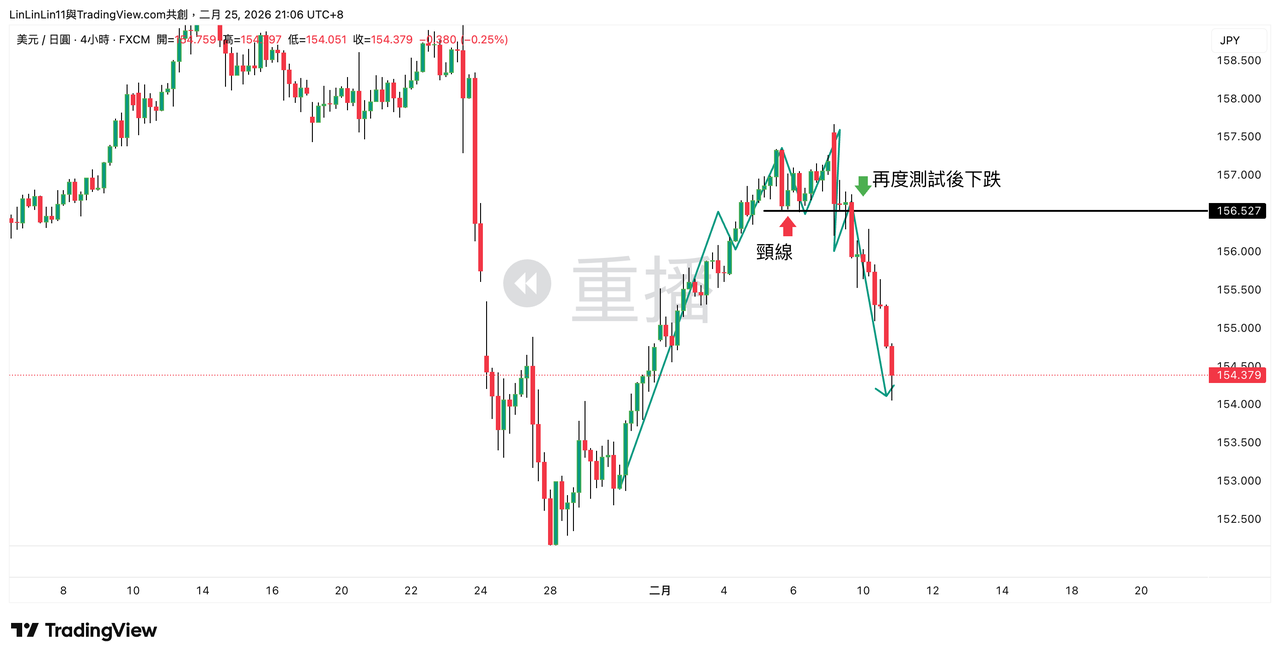
A double top is a top reversal pattern that appears at the end of an uptrend. The price forms two nearly equal highs, separated by a pullback, indicating that bullish momentum is gradually weakening, and bearish forces may take over.
Structural Characteristics:
- First High: Price rises to a high point, then pulls back due to profit-taking or resistance.
- Second High: Price attempts to re-climb but fails to break above the previous high, forming the second peak in an "M" shape.
- Neckline: Connects the low point between the two highs, typically horizontal or slightly sloping.
- Neckline Breakdown: If the price effectively breaks below the neckline with increased volume, the pattern is confirmed.
Pro Tip: If the time interval between the two peaks is long (e.g., several weeks or more), the reversal signal is more reliable. If it's only a day or two, its reference value significantly decreases.
Second Type: Head and Shoulders Pattern (Head and Shoulders Top)
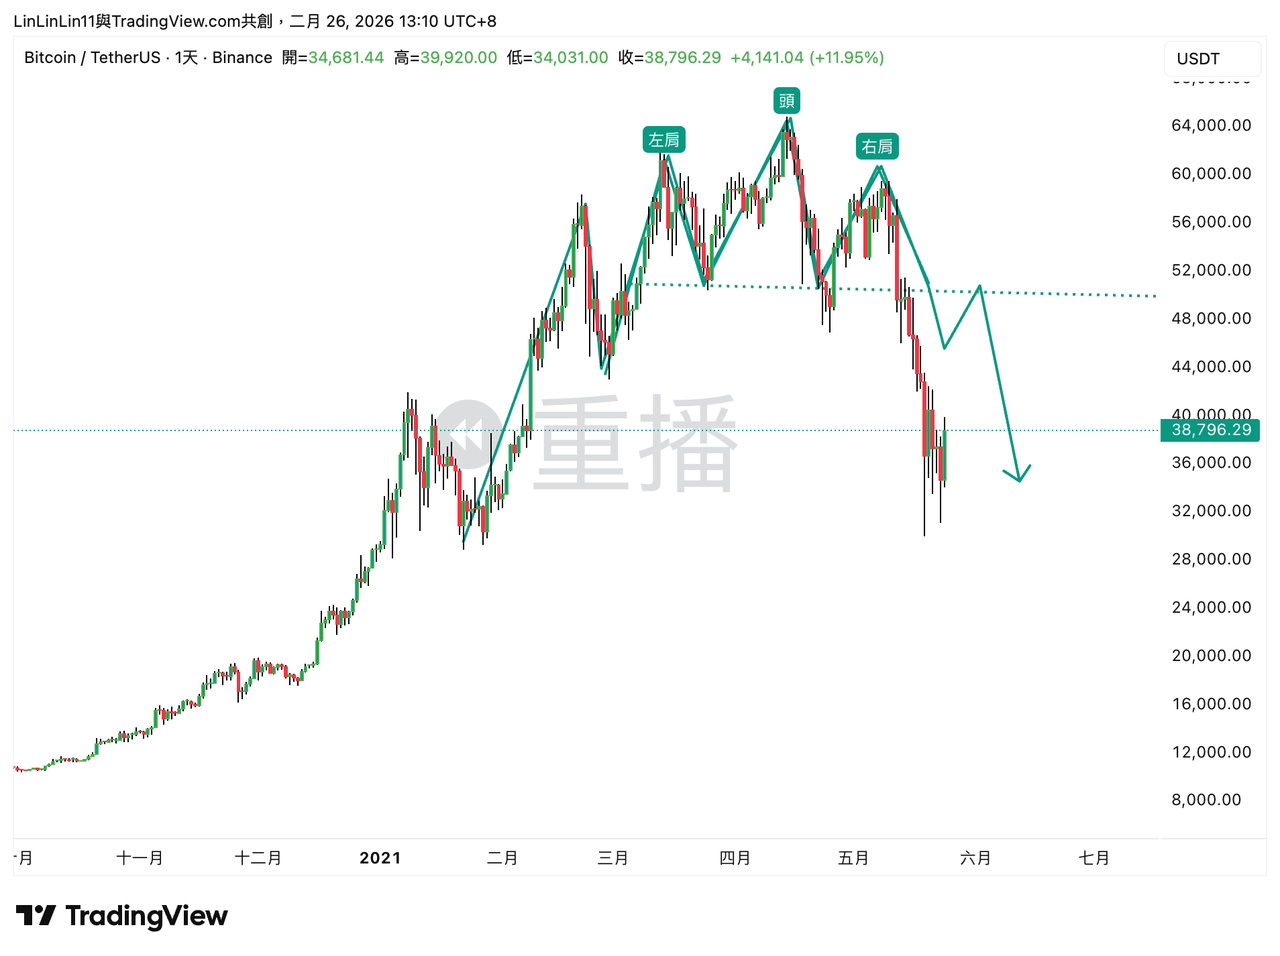
Head and Shoulders Top
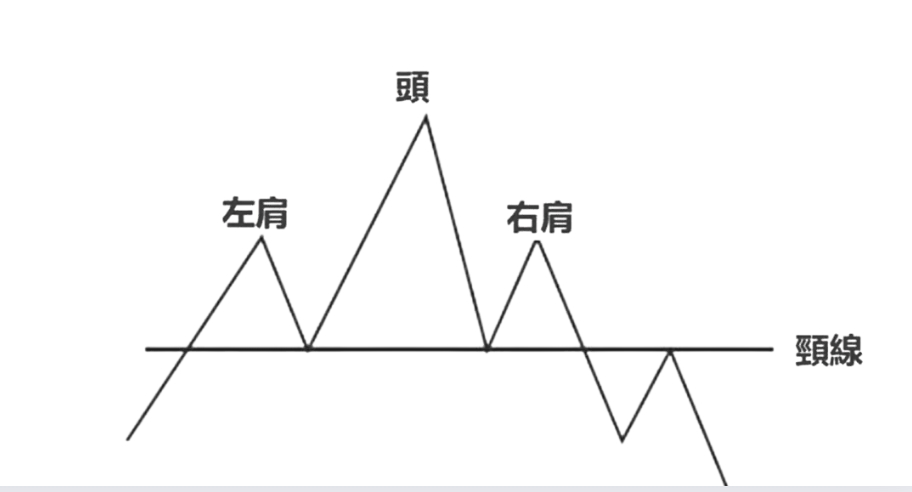
A top reversal pattern, its structure resembles a human head with two shoulders. It usually appears after a prolonged uptrend, indicating that bullish momentum is gradually fading, and the market may turn downwards.
Structural Characteristics:
- Left Shoulder: Price rises to a first high point, then pulls back.
- Head: Price rises again, surpassing the previous high to form a higher high, then pulls back.
- Right Shoulder: Price rises a third time, but the high cannot surpass the head, usually similar in height to the left shoulder or slightly lower, then pulls back.
- Neckline: A support line connecting the two low points of the pullbacks, typically slightly horizontal or gently sloping.
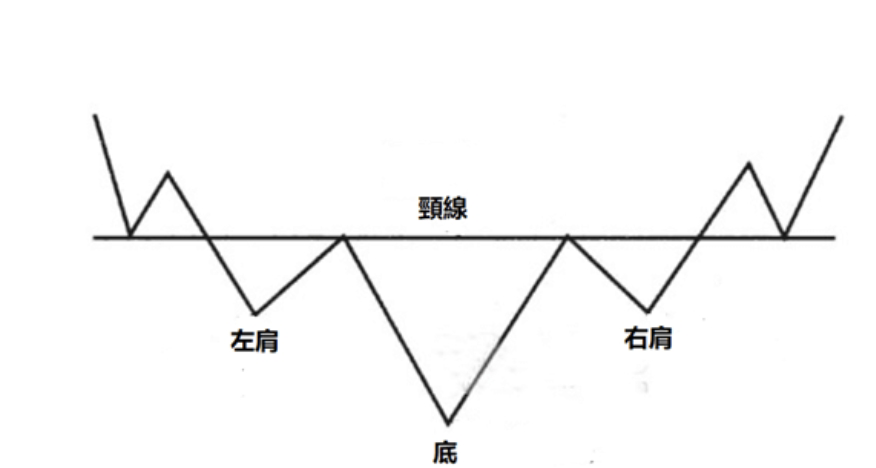
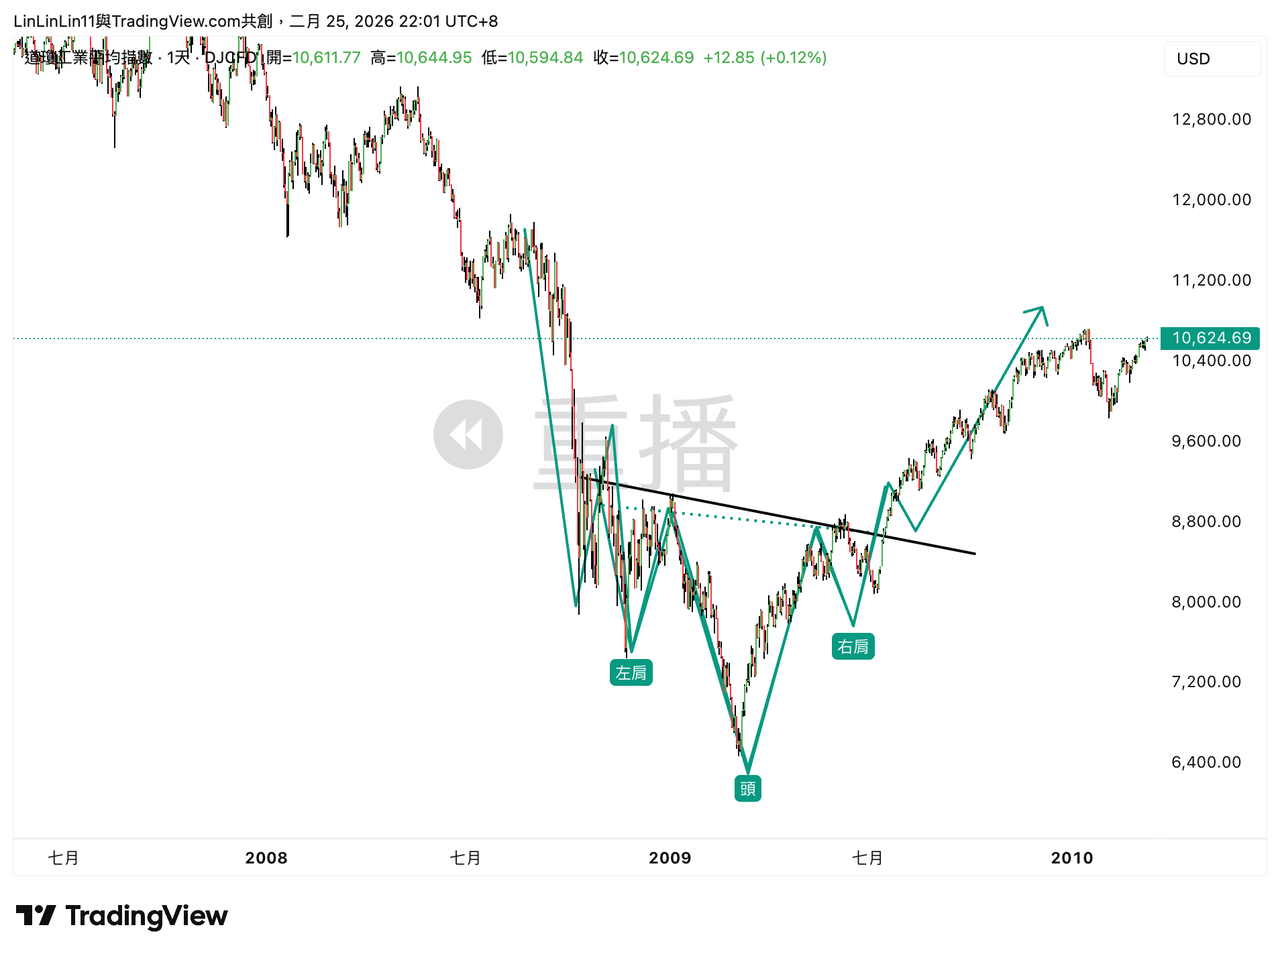
Head and Shoulders Bottom
The logic is opposite to the Head and Shoulders Top, making it a highly valuable bottom reversal signal.
Two Major Continuation Patterns: Mid-Trend Pause
First Type: Flag Pattern (Flag)
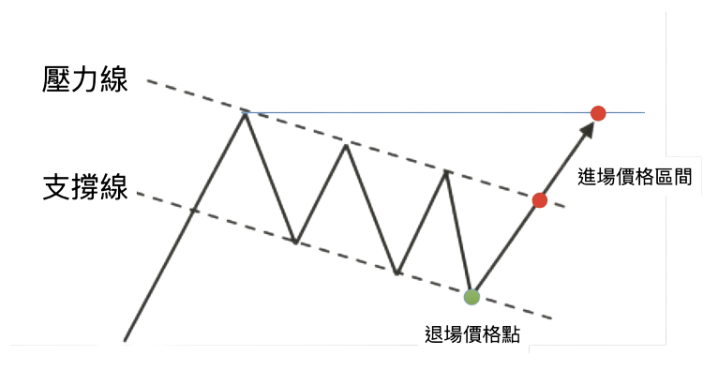
Ascending Flag
A common continuation pattern in technical analysis, usually appearing after a sharp upward move.
Structural Characteristics:
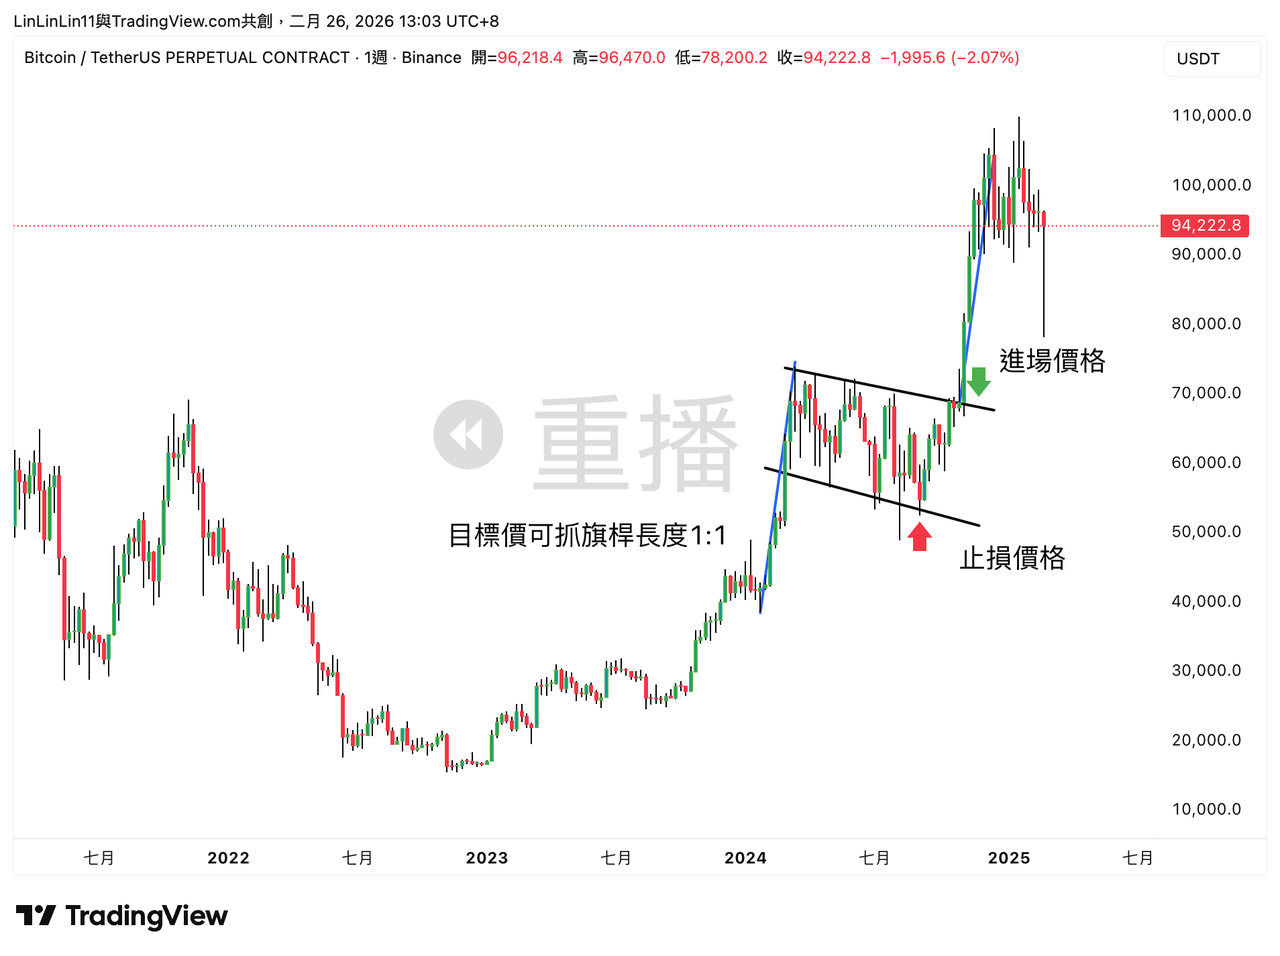
- Flagpole: The preceding price action sees a rapid surge, forming one or several large bullish candlesticks, representing strong buying impetus.
- Flag: After the rally, the price doesn't immediately make new highs but enters a short-term sideways consolidation with a slight downward drift. This consolidation typically forms a parallel, slightly downward sloping channel, resembling a flag.
- Entry Timing for Buying: The optimal buying opportunity is when the price breaks above the upper boundary of the ascending flag.
- Confirmation Signal: The breakout must be accompanied by increased trading volume to confirm its validity.
- Stop-Loss Setting: It is recommended to place the stop-loss below the lower boundary of the flag to manage risk.
Descending Flag
Structural Characteristics:
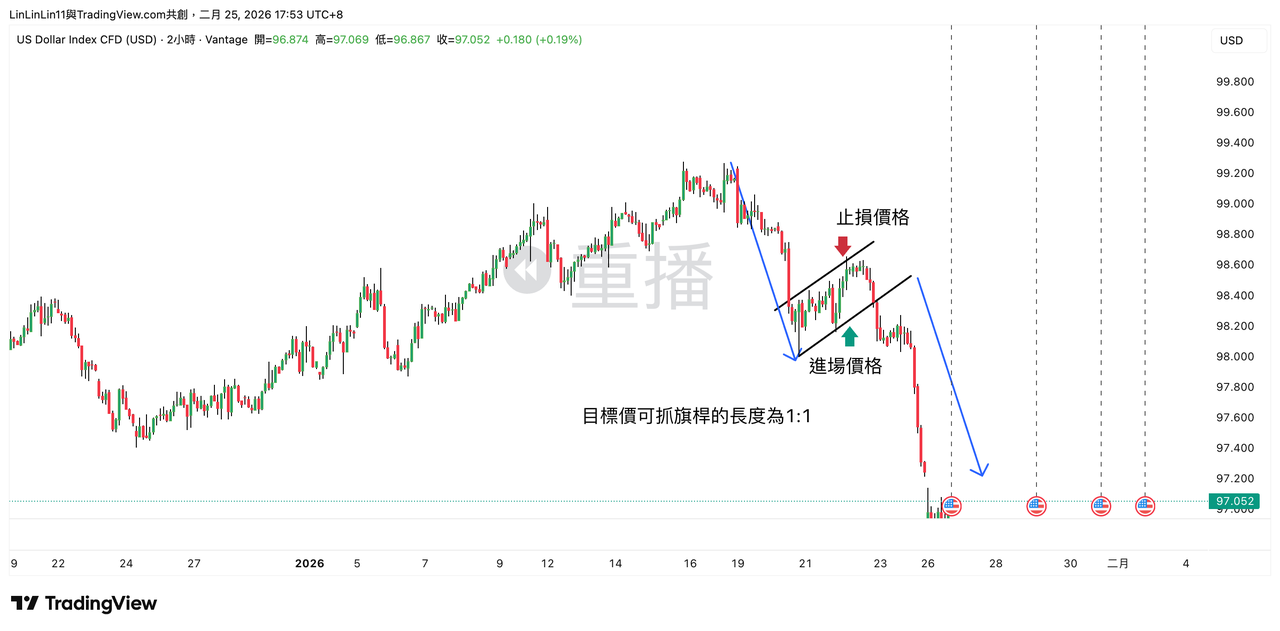
- Flagpole: A preceding sharp downward move, usually accompanied by long bearish candlesticks with increased volume, indicating strong bearish power.
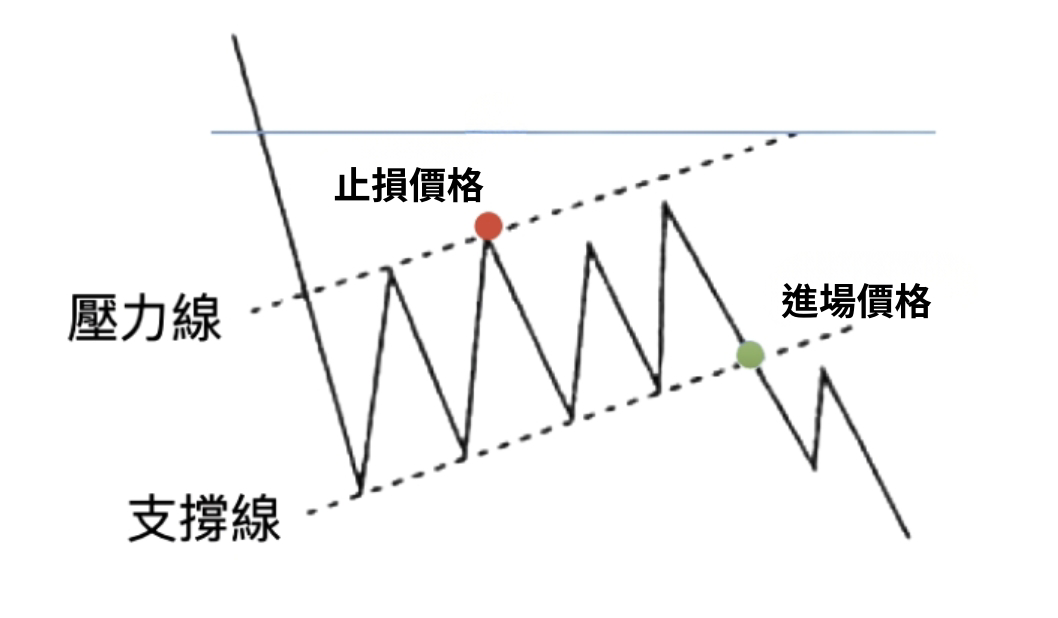
- Flag: After the fall, the price does not immediately continue downwards but briefly enters a sideways movement with a slight rebound. The consolidation area forms a parallel or slightly upward sloping channel.
- Breakout Direction: In most cases, it will naturally break below the lower boundary of the flag, continuing the original bearish trend.
- Entry Timing for Selling: The optimal selling opportunity is when the price breaks below the lower boundary of the descending flag.
- Confirmation Signal: The breakdown must be accompanied by increased trading volume to confirm its validity.
- Stop-Loss Setting: It is recommended to place the stop-loss above the upper boundary of the flag to manage risk.
Second Type: Wedge Pattern (Wedge)
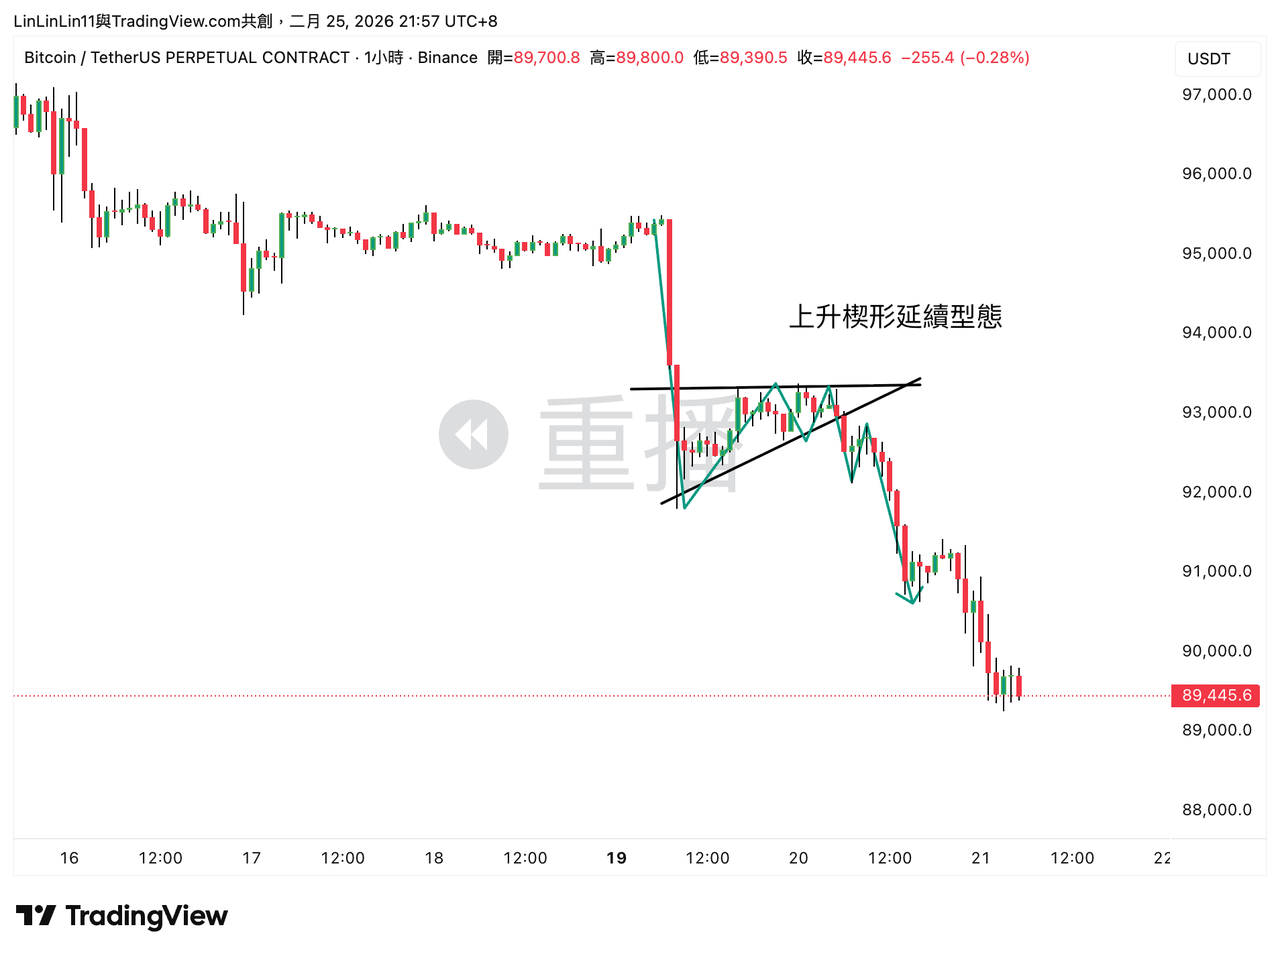
Rising Wedge
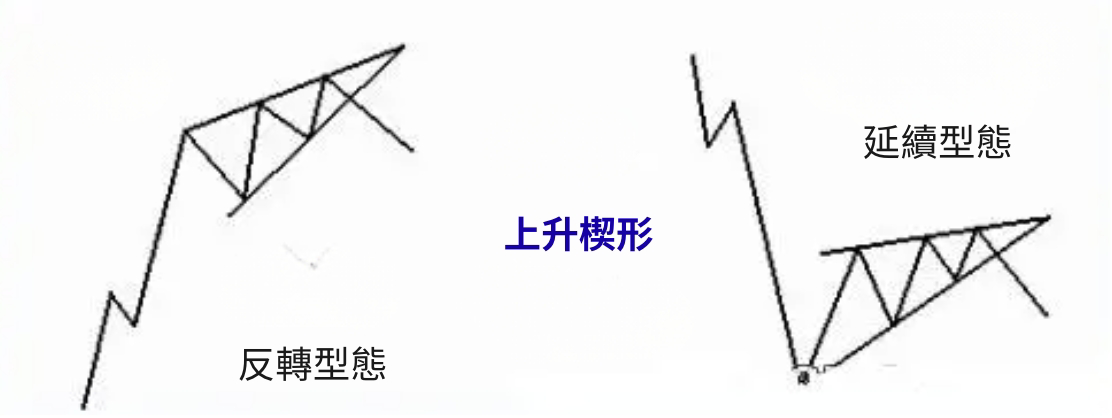
- Characteristics: Both price highs and lows gradually increase, but the slope gradually flattens, and the lines converge upwards.
- Meaning: Although bullish forces push the price higher, the upward momentum weakens with each push, indicating insufficient buying power. It appears to be advancing, but compared to a flag pattern, it's struggling.
- Common Scenarios:
- Appears in an uptrend → May become a reversal pattern, followed by a downturn.
- Appears in a downtrend → Usually a continuation pattern, followed by a sharp decline.
- Key Trading Points: Enter a short position upon breaking below the lower boundary with increased volume. Place stop-loss at the wedge's highest point. Set TP1 at the wedge's lowest point. After TP1, trail stop-loss to breakeven.
Falling Wedge
- Characteristics: Both price highs and lows gradually decrease, but the decline range gradually narrows, and the lines converge downwards.
- Meaning: Although bearish forces push the price lower, the downward momentum weakens with each push, indicating that selling pressure is gradually diminishing. This usually signifies exhausted bearish power. Once it breaks above the upper boundary with increased volume, the rebound is often significant.
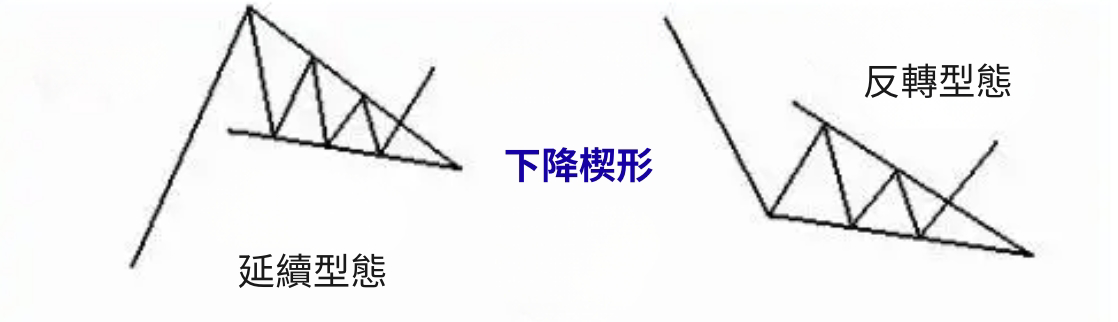
- Common Scenarios:
- Appears in a downtrend → May become a reversal pattern, followed by an upward rebound.
- Appears in an uptrend → Usually a continuation pattern, followed by continued ascent.
- Key Trading Points: Enter a long position upon breaking above the upper boundary with increased volume. Place stop-loss at the wedge's lowest point. Set TP1 at the wedge's highest point. After TP1, trail stop-loss to breakeven.