Author: LBank Research Analyst: Ludo
1. Core Conclusion
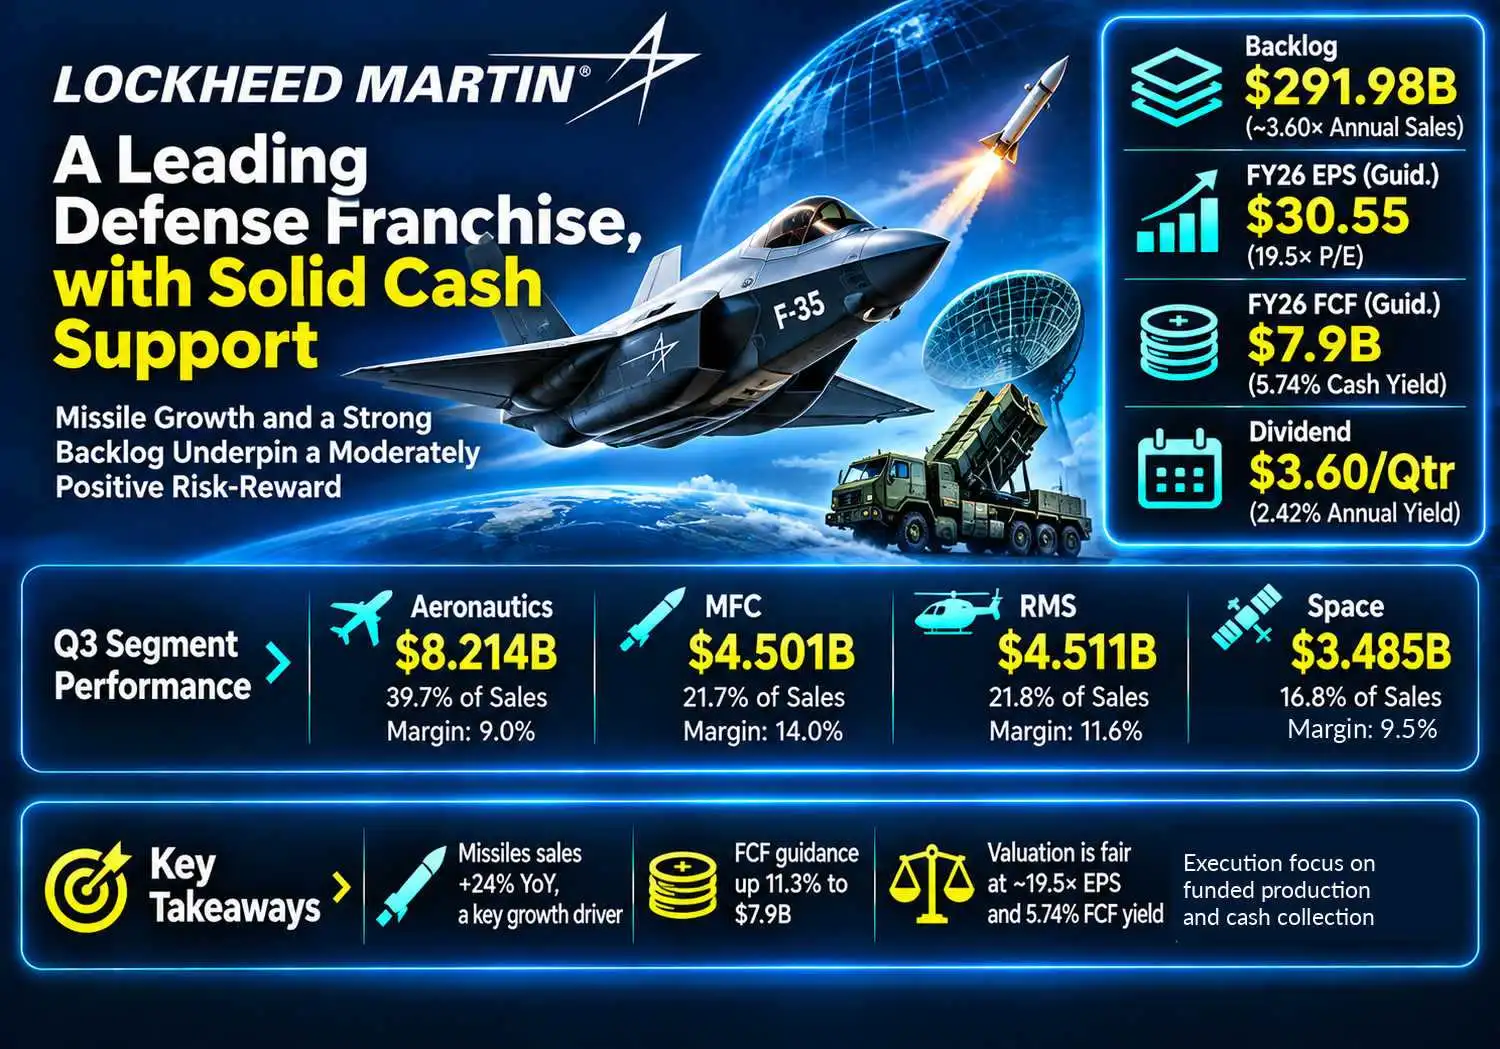
Overall judgment: Lockheed Martin Corporation is a strong defense franchise with a reasonably valued equity and a moderately positive risk-reward tilt. Missile production gives the growth thesis substance, but conversion of funded work into cash is the decisive variable. At the November 13 regular-session close of USD 596.04, the stock trades at 19.5x the FY26 diluted EPS guidance midpoint of USD 30.55. Management's FCF midpoint of USD 7.9 billion represents a 5.74% prospective equity cash yield against USD 137.69 billion of market capitalization. That is a credible valuation anchor, provided the cash guidance is delivered.
-
The backlog supports duration rather than instant earnings. The USD 291.984 billion backlog is 3.60x the USD 81 billion annual sales guidance midpoint. However, management expects only about 23% of backlog to become revenue over the next twelve months. The investment case rests on a sustained production runway, not an assumption that every new award immediately raises next-quarter EPS.
-
Missiles are the clearest operating winner. MFC sales increased 24% while its segment margin remained around 14%. Its USD 0.877 billion sales increase accounted for 41.7% of the company's quarterly sales increase. This is a better foundation for the thesis than relying on broad defense-spending headlines without a conversion mechanism.
-
The cash upgrade is more important than the small earnings upgrade. FCF guidance midpoint rose from USD 7.1 billion in July to USD 7.9 billion, an 11.3% increase; EPS midpoint rose from USD 30.30 to USD 30.55, or 0.8%. Better payment timing and cash recovery can therefore matter more for valuation than a marginal change in reported profitability.
-
Aircraft volume is not sufficient evidence of improving economics. Aeronautics sales grew 13%, but segment margin slipped from 9.4% to 9.0%. At the reporting cutoff, Lot 20 advance-acquisition costs had exceeded existing authorization and funding. Revenue scale must be accompanied by contract funding and cost control before it creates dependable owner cash.
-
The valuation offers support, not immunity from execution risk. A cash yield near 5.74% is useful alongside long-lived programs, but it uses management's full-year forecast. Nine-month FCF of USD 5.625 billion still requires USD 2.175–2.375 billion in the remaining quarter to reach guidance. Failure to collect or new program losses would reduce both cash and the multiple assigned to that cash.
Our valuation sensitivities are analyst illustrations, not formal targets or consensus forecasts. At USD 7.0 billion of annual FCF and a 6% equity cash yield, implied equity value is USD 116.7 billion, 15.3% below the reference capitalization. A central example of USD 7.9 billion at 5.75% gives USD 137.4 billion, essentially the current valuation. A stronger USD 8.5 billion at 5.25% gives USD 161.9 billion, or 17.6% higher. These are price-value comparisons before dividends; the yield assumptions reflect our assessment of durability and risk, not a measured peer average. The base conclusion is fair valuation with a positive operating bias, rather than deep undervaluation.
The new quarterly dividend of USD 3.60 implies USD 14.40 annualized if maintained and a 2.42% yield at the reference price. It is a distribution from business cash generation and must not be added to the FCF yield as though it were another source of cash. Equity holders and LMTUSDT contract holders have different rights; the contract does not confer stock ownership or dividend entitlement.
2. Company Overview, Business Mix, and Core Operating Metrics
Lockheed Martin develops, produces and sustains complex defense and aerospace systems. Governments are the principal customer base, with long procurement cycles, demanding technical milestones and limited qualified alternatives. The company earns revenue through production, development, maintenance and support arrangements. Fixed-price contracts reward good execution but expose the contractor to overruns; cost-reimbursable arrangements provide different protection and incentive structures. Revenue recognized as work progresses can arrive before the associated billing or collection.
The portfolio has four reportable business segments. Aeronautics combines combat aircraft and air mobility with sustainment. MFC produces interceptors, tactical missiles and strike systems. RMS brings together helicopters, naval and radar systems and mission integration. Space covers strategic, missile-defense and space missions. Different programs can be at development, ramp, mature production or support stages at the same time. This diversification supports the franchise, while making group revenue an incomplete measure of economic progress.
|
Q3 2026 business
|
Sales, USD bn
|
Sales share
|
Segment margin
|
Products and economics
|
|
Aeronautics
|
8.214
|
39.7%
|
9.0%
|
F-35, F-16, C-130 and related sustainment; production scale with contract-estimate risk
|
|
Missiles and Fire Control (MFC)
|
4.501
|
21.7%
|
14.0%
|
PAC-3, THAAD, GMLRS and PrSM; production ramps and replenishment demand
|
|
Rotary and Mission Systems (RMS)
|
4.511
|
21.8%
|
11.6%
|
Sikorsky helicopters, radar, maritime and mission systems; broad installed base
|
|
Space
|
3.485
|
16.8%
|
9.5%
|
Strategic missiles, missile defense and space programs; technical milestones and program mix
|
Sales shares use total quarterly revenue of USD 20.711 billion. The segment margins are management's segment measure, not consolidated GAAP operating margins. The four segment operating profits total USD 2.229 billion; consolidated operating profit is USD 2.443 billion after pension and other unallocated items. Treating those measures as interchangeable would overstate or misstate program profitability.
Core operating metrics and changes
|
Operating signal
|
Verified disclosure
|
Investment implication
|
|
Backlog
|
USD 291.984bn at September 27; +27% sequentially
|
A long-duration demand base, not immediately collectible cash
|
|
Missile concentration
|
MFC backlog USD 142.517bn; PAC-3 MSE award added USD 52.5bn
|
Nearly half of backlog resides in MFC, increasing capacity-conversion importance
|
|
Delivery horizon
|
Approximately 23% of backlog expected as revenue within 12 months; 40% within 24
|
Timing constrains how quickly record orders can affect earnings
|
|
Aircraft execution
|
43 F-35 deliveries in Q3; 274 aircraft backlog
|
Demand exists, but authorization and funding must keep pace with work
|
|
Revenue and profit guide
|
FY26 sales USD 80–82bn; segment operating profit USD 8.575–8.675bn
|
Revenue midpoint USD 81bn; segment profit midpoint USD 8.625bn
|
|
Cash and EPS guide
|
FY26 FCF USD 7.8–8.0bn; diluted EPS USD 30.35–30.75
|
A bigger cash revision than the earnings revision
|
|
Recent technical milestone
|
November 4 Mk21A developmental flight test
|
Supports program progress; no separate near-term sales uplift modeled
|
The latest financial period is the quarter ended September 27, reported October 22. The November 4 Mk21A test is a technical development milestone. It supports confidence in the program's progress but does not establish a new sales award, delivery schedule or incremental profit contribution. We attach no standalone earnings uplift to that event.
Backlog growth is concentrated. MFC represents 48.8% of total backlog, and the quarterly increase includes USD 52.5 billion associated with the multi-year PAC-3 MSE award. Large multi-year commitments improve production planning and supplier visibility, but they also place more weight on manufacturing capacity, yields and supplier execution. Award size by itself cannot establish an attractive return on incremental invested capital.
Applying the disclosed 23% twelve-month conversion estimate to reported backlog gives approximately USD 67.16 billion of revenue coverage. The cumulative 40% estimate for twenty-four months implies that most backlog extends beyond that horizon. These estimates are as of the filing date, include revenue-recognition assumptions, and are not independent annual sales guidance. New orders, modifications and contract-estimate changes will affect the realized path.
The central operating question is therefore whether rising demand can be manufactured and financed at attractive economics. Orders help answer the demand question. Segment margins, contract assets and collections answer the value-creation question. A business can score strongly on the former and disappoint on the latter for several quarters.
3. Fundamental Quality
Revenue visibility is strong, underlying execution is mixed, and liquidity is adequate. Nine-month cash generation improved substantially, but quarterly FCF declined against a strong comparative period. Margin and cash analysis should therefore use both quarterly and cumulative evidence, rather than selecting whichever period produces the most favorable narrative.
|
Metric
|
Q3 2025
|
Q3 2026
|
9M 2025 → 9M 2026
|
|
Sales, USD bn
|
18.609
|
20.711
|
54.727 → 58.795
|
|
Segment operating profit, USD bn
|
2.029
|
2.229
|
4.685 → 6.214
|
|
Segment operating margin
|
10.9%
|
10.8%
|
8.6% → 10.6%
|
|
Consolidated operating profit, USD bn
|
2.280
|
2.443
|
5.400 → 6.985
|
|
GAAP net earnings, USD bn
|
1.619
|
1.845
|
3.673 → 5.169
|
|
GAAP diluted EPS, USD
|
6.95
|
7.97
|
15.69 → 22.36
|
|
Operating cash flow, USD bn
|
3.728
|
3.438
|
5.338 → 6.893
|
|
Capital expenditure, USD bn
|
0.381
|
0.439
|
1.186 → 1.268
|
|
FCF, USD bn
|
3.347
|
2.999
|
4.152 → 5.625
|
|
Cash, USD bn
|
3.470
|
5.960
|
Balance-sheet dates, not cumulative flows
|
|
Debt carrying value, USD bn
|
Not used
|
20.498
|
December 31, 2025: 21.700
|
|
Contract assets, USD bn
|
Not used
|
16.899
|
December 31, 2025: 13.001
|
FCF is the company's non-GAAP measure of operating cash flow less capital expenditure. Quarterly FCF equals 3.438 − 0.439 = USD 2.999 billion; nine-month FCF equals 6.893 − 1.268 = USD 5.625 billion. Nine-month FCF increased 35.5%, while quarterly FCF fell 10.4%. The company attributed the quarterly reduction primarily to higher customer receipts in the prior-year quarter. Annualizing one quarter's USD 2.999 billion would exaggerate a cash stream affected by timing.
Nine-month FCF covered cash dividends of USD 2.408 billion by 2.34x. There were no program share repurchases during the period, while USD 1.168 billion of long-term debt was repaid. This capital allocation preserves flexibility while funding production commitments. Lower average shares compared with the prior year can still benefit EPS because of earlier repurchases; they should not be presented as evidence of fresh 2026 buybacks.
Cash of USD 5.960 billion against debt carrying value of USD 20.498 billion implies approximately USD 14.538 billion of net debt. This simplified calculation excludes pension liabilities, leases and other enterprise-value adjustments. It indicates a manageable financing burden rather than a surplus-cash balance sheet. The dividend and debt reduction are sustainable only if cash conversion survives the production ramp.
Contract assets increased from USD 13.001 billion at year-end to USD 16.899 billion, approximately 30%. The cash-flow statement records a USD 3.898 billion use of cash from that balance. Customer advances and progress payments can offset part of the burden, so contract assets should be interpreted alongside contract liabilities, which increased to USD 12.644 billion. The distinction is economically important: performance can be recognized before all contractual billing conditions are satisfied, and signed demand is not a substitute for funding authorization.
Reported earnings also reflect pension accounting and earlier program losses. The prior-year nine-month period included USD 1.615 billion of reach-forward losses on selected programs. Their absence helps explain the current year-on-year profit recovery, so the 33% increase in segment operating profit is not a clean measure of recurring organic leverage. The current quarter is a more restrained signal: segment profit grew about 10% against sales growth of 11%, while group segment margin edged lower.
Reproducible transmission from production to valuation
Consider an analyst sensitivity in which additional funded missile capacity produces USD 1.0 billion of incremental annual revenue. This is a hypothetical amount, not a disclosed production forecast or an estimate of the annual value of the PAC-3 award. Assume the current 14% MFC segment margin approximates incremental operating profitability, hold corporate costs and pension effects constant, and apply a 15% illustrative tax rate. Incremental after-tax earnings are 1.0 × 14% × 85% = USD 0.119 billion. Dividing by the quarter's 231.5 million diluted weighted-average shares produces approximately USD 0.514 of EPS.
If 80% of that after-tax increment converts into FCF after incremental investment and working-capital requirements, incremental annual cash is USD 0.0952 billion. At an illustrative 5.75% equity cash yield, that contribution supports USD 1.66 billion of equity value, or about USD 7.15 per diluted share. The chain is funded orders → capacity and deliveries → revenue → segment margin → after-tax cash → equity value. These are sensitivity assumptions; they are not amounts to add to a base valuation that already includes growth.
This modest result relative to a multi-billion-dollar backlog illustrates why production economics matter. A USD 1.0 billion delay in cash collection would temporarily reduce the prospective equity cash yield by approximately 0.73 percentage points at the reference capitalization, much more than the 0.07 percentage-point yield contribution from the modeled incremental FCF. A timing delay and a permanent earnings loss are different, but both affect financing flexibility and investor confidence. The single most important variable is funded conversion of work into cash without new margin-eroding program charges.
4. Industry and Competitive Landscape
The relevant industry is government-funded defense platforms and systems, including combat aircraft, missiles, strategic capabilities, maritime programs and space infrastructure. Competition occurs at program selection, production scaling, sustainment and technology insertion. Qualification barriers and long service lives protect established suppliers, but also make failures, delays and changes in customer requirements expensive. A favorable demand environment can coexist with poor contractor returns when obligations are priced or executed badly.
Multi-year procurement improves planning by making the demand horizon more visible. The limiting factors then shift toward skilled labor, components, supplier throughput, manufacturing quality and customer funding. The company that books the largest contract does not automatically generate the highest shareholder return; the award's duration, margin, capital needs and collection profile all matter. We therefore compare actual segment economics and cash evidence alongside backlog.
|
Industry position
|
Observable evidence
|
Who benefits / valuation effect
|
|
Air and missile defense
|
MFC sales +24% and segment margin 14.0%
|
Lockheed Martin is a clear production-ramp beneficiary; capacity and cost control determine returns
|
|
Combat aircraft
|
Aeronautics sales +13%, margin 9.0% versus 9.4%
|
Revenue wins coexist with margin dilution; F-35 funding affects cash realization
|
|
Strategic and space programs
|
Space sales +4%; operating profit flat
|
Program breadth supports duration, but does not guarantee profit acceleration
|
|
Competing defense platforms
|
Northrop Grumman backlog USD 109.6bn; General Dynamics USD 220bn
|
Multiple primes have visibility; large backlogs alone do not establish share gains
|
|
Adjacent aerospace and missiles
|
RTX total sales +11%; defense backlog USD 164bn
|
Replenishment benefits several suppliers; commercial aerospace changes RTX comparability
|
These are scale and operating indicators, not market-share statistics. The companies have different program portfolios, contract definitions and commercial exposure. Dividing their reported backlogs by a combined total would not produce a meaningful defense-market share. Nor does a faster reported sales growth rate alone show that one contractor took a program from another.
|
Company / latest reported quarter
|
Sales / YoY growth
|
Margin, cash or backlog evidence
|
Comparison boundary
|
|
Lockheed Martin Corporation / Sep 27, 2026
|
USD 20.711bn / +11%
|
Segment margin 10.8%; FCF USD 2.999bn; backlog USD 291.984bn
|
Primarily defense; segment profit excludes certain corporate and pension items
|
|
Northrop Grumman Corporation / Sep 30, 2026
|
USD 11.1bn / +7%
|
Segment margin 12.1%; consolidated margin 11.4%; backlog USD 109.6bn
|
Different strategic, space and mission-systems exposure; segment definition differs
|
|
RTX Corporation / Sep 30, 2026
|
USD 25.0bn / +11%
|
FCF USD 2.1bn; backlog USD 340bn, including USD 164bn defense
|
Includes commercial aerospace; EPS and cash include IEEPA recovery
|
|
General Dynamics Corporation / Oct 4, 2026
|
USD 14.6bn / +12.9%
|
Consolidated margin 10.5%; CFO USD 1.7bn; backlog USD 220bn
|
Includes Gulfstream and shipbuilding; different production and cash cycles
|
The periods are the latest reported fiscal quarters and are close but not identical. Segment operating margins exclude company-specific items and cannot be ranked as though every exclusion were identical. RTX combines commercial aerospace with defense, and its quarterly result includes IEEPA recovery; General Dynamics includes commercial aircraft and shipbuilding. Their total-company cash flows do not isolate the economics of a directly competing missile or aircraft program.
Lockheed Martin's MFC business and RTX's missile franchise are clear beneficiaries of replenishment and capacity expansion; General Dynamics shows strong revenue growth and order visibility; Northrop Grumman retains a substantial strategic and space position. Lockheed Martin is a net beneficiary of defense demand. Within its own portfolio, Aeronautics is losing margin despite revenue growth, while Space is failing to convert sales growth into higher quarterly operating profit. Those are observable relative weaknesses, not a claim that the entire franchise is losing structural market share.
The competitive advantage is program relevance, integration capability and a large sustainment base. The principal financial weakness is the need to commit engineering and production resources before every funding condition is resolved. A fair valuation can become attractive if the company reduces that gap; it can become expensive if investors capitalize backlog at optimistic margins while ignoring the cash tied up in execution.
5. Key Risks
-
Funding and authorization lag production. If work continues ahead of contractual authorization, contract assets and pre-contract costs can grow faster than customer payments. Cash guidance, debt flexibility and the equity cash-yield case would weaken even if revenue remained resilient.
-
Missile ramp economics disappoint. If supplier bottlenecks, labor constraints or manufacturing inefficiency push MFC margin below 13%, incremental backlog conversion may produce less profit than modeled. Higher capital requirements would further reduce FCF.
-
Aircraft and helicopter program charges recur. New unfavorable cost estimates or delivery delays can trigger loss recognition before a program's cash expenditure is complete. The apparent earnings recovery from a weak prior-year base would then prove less durable.
-
Long-duration backlog shifts or shrinks. Contract modifications, customer reprioritization, estimates of variable consideration or cancellation can alter backlog without equivalent revenue. The headline order stock would overstate the dependable profit runway.
-
Cash timing is mistaken for structural improvement. Strong advances or collections can move cash between quarters. If the full-year result misses the USD 7.8 billion FCF floor, the prospective 5.74% yield would need to be revised rather than defended using a favorable quarter.
-
Pension and non-operating items distort comparability. Changes in pension accounting, taxes or investment-related results can move EPS independently of production economics. Assigning a premium to such changes would create a valuation vulnerable to reversal.
-
Development and joint-venture obligations consume capital. Technical or schedule problems can require financial support or investment beyond initial expectations. Those claims compete with dividends and debt reduction and can erode cash available to equity holders.
6. Monitoring Checklist
-
Remaining-quarter cash: USD 2.175–2.375 billion of FCF is needed to reach the current annual range. Delivery strengthens confidence in the cash anchor; a miss requires a lower valuation base.
-
MFC economics: sustain approximately 14% segment margin as volumes rise. Below 13% is our analytical warning threshold, particularly if accompanied by higher capital expenditure.
-
Aircraft funding: verify explicit contractual authorization and funding for work beyond existing limits. A falling contract-asset burden alongside continued production strengthens the thesis; another unfunded increase weakens it.
-
Contract assets: compare the USD 16.899 billion balance with sales growth and billing progress. Continued growth materially above sales, without a funding explanation, would indicate deteriorating conversion.
-
Portfolio margins: Aeronautics recovering above 9.0% and Space turning sales growth into profit growth would broaden the earnings base. Further deterioration would leave more reliance on missiles.
-
Backlog quality: track the USD 291.984 billion baseline and its twelve-month conversion share, rather than only award headlines. Better funded visibility and on-time conversion are supportive; extensions without cash delivery are not.
-
Capital allocation: follow cash dividend coverage, net debt and production investment together. The December 1 dividend record date and December 31 payment are confirmed; no unverified next earnings date is assumed.
7. Sources
Information cutoff: November 16, 2026, Asia/Shanghai. Underlying-equity reference: November 13 completed U.S. regular session. Latest company financials: September 27 quarter and nine months, released October 22. Guidance is forward-looking management information, not realized cash; valuation sensitivities are our assumptions. No market consensus, sell-side rating or consensus target is asserted.
Selection followed a screen of LMTUSDT, COSTON/USDT and AAPLON/USDT; the latter two had already been covered. Lockheed Martin has no prior entry in the coverage tracker. Its historical spot listing was examined but its spot route returned an unavailable page, so it was not used to establish eligibility. The independently discovered and opened LMTUSDT futures route contains contract configuration, the Stocks tag and nonzero embedded turnover, beyond an HTTP status or title. Several text-rendered quote fields remain blank. We therefore verify the identified contract interface and stock mapping, without asserting a live executable quote or substituting the contract price for the stock price. Technical testing headlines are not treated as new revenue awards. Contract-funding warnings are attributed to the reporting-date disclosure; the report does not assume a subsequently negotiated settlement that has not been independently verified.
-
-
-
-
-
-
-
-
RTX Reports Q3 2026 Results (https://investors.rtx.com/static-files/46b42314-8297-41ea-91cd-4e4ddd2e9518) — October 20, 2026; total versus defense backlog and IEEPA recovery caveat.
-
-
Lockheed Martin (LMT) Stock Price, Chart & News (https://stockanalysis.com/stocks/lmt/) — Secondary market-data vendor; November 13 regular-session close USD 596.04 and market capitalization USD 137.69bn. Vendor forward multiples and consensus targets are not used.
-
-
LMTUSDT Futures Trading | LBank Futures (https://www.lbank.com/futures/lmtusdt) — Opened November 16; Perp, order controls and order-book interface, with embedded LMT instrument configuration, Stocks tag and nonzero turnover. Several rendered quote fields are placeholders; no live executable price asserted.
-
-
-
COSTON/USDT Spot Trading | LBank (https://www.lbank.com/trade/coston_usdt) — Candidate screened November 16; populated embedded company and market data; previously covered.
-
AAPLON/USDT Spot Trading | LBank (https://www.lbank.com/trade/aaplon_usdt) — Candidate screened November 16; populated embedded company and market data; previously covered.
-
-



 Transfer