Author: LBank Research Analyst: Ludo
Disclaimer: This report is compiled and analyzed from publicly available information and is intended solely for information sharing and research discussion. It does not constitute investment advice, a securities recommendation, a trading instruction, or any guarantee of returns. The company operations, valuations, market prices, and consensus expectations discussed herein may change over time. Readers should independently verify the data and make their own decisions.
1. Core Conclusion
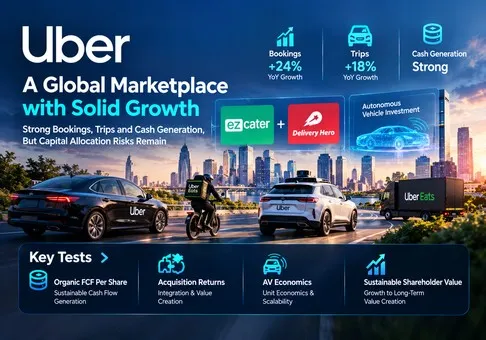
Overall judgment: Uber Technologies, Inc. is a strong marketplace operator, and the equity appears modestly undervalued on a standalone cash-generation basis; our risk-reward view is positive, with capital allocation the decisive variable. The October 6 ezCater agreement makes this a timely test of whether operating success becomes shareholder value. Acquisitions and autonomous-vehicle commitments can consume the apparent valuation discount even when reported FCF remains healthy.
-
The operating franchise has earned a positive quality assessment. Bookings growth of 24% and Trips growth of 18% in Q2 indicate expanding demand rather than reliance on price alone. The investment implication is that the existing network deserves continuing-business value independent of a successful robotaxi outcome.
-
The cash-flow valuation offers a useful cushion, with an important qualification. At the October 7 regular-session close of USD 68.45, secondary market data put equity capitalization at USD 139.81 billion. Against management's USD 10.1 billion TTM FCF, that is 13.84x and a 7.22% yield, calculated. This supports value, but FCF excludes acquisition consideration and does not remove dilution costs.
-
ezCater is strategically coherent, but its purchase return is unproven. USD 2.3 billion divided by more than USD 2.5 billion in TTM bookings is below 0.92x bookings. Bookings are customer spending, not revenue or earnings, so this ratio cannot establish that the asset is cheap. The report assigns no quantified synergy value without a disclosed profit base.
-
Delivery Hero creates the larger capital-allocation hurdle. The announced USD 13.7 billion equity value adjusted for prior stake purchases represents 1.36x Uber's TTM FCF. This is a scale comparison, not a closing funding forecast. Shareholders need evidence that acquired earnings and integration savings compensate for financing costs and execution risk.
-
AV distribution is credible, while AV shareholder returns remain uncertain. Management plans more than USD 10 billion of capital commitments over several years. The distinction between equity stakes, infrastructure spending and vehicle offtake matters: each carries different cash timing and risk. A good distribution position deserves optionality; undisclosed AV unit economics do not justify a large premium.
Our valuation sensitivity is deliberately transparent. Holding the current share base fixed, applying an illustrative 15–18x multiple to USD 10.1 billion of annual FCF gives USD 151.5–181.8 billion of equity value, equivalent to approximately USD 74.17–89.01 per share using 2.0425 billion shares implied by the quote and market capitalization. These are analyst-selected sensitivity assumptions, not consensus or price targets. If normalized FCF falls 20% to USD 8.08 billion and investors pay only 12x, equity value falls to USD 96.96 billion, or roughly USD 47.47 per share. The downside is material despite the attractive starting yield. No acquisition financing, purchased earnings or AV return is included in these standalone sensitivities.
2. Company Overview, Business Mix, and Core Operating Metrics
Uber monetizes a network connecting consumers, drivers, couriers and merchants. Its economics depend on making transactions convenient enough to become habitual, while leaving partners sufficient earnings to maintain service availability. Ride matching, delivery commissions, merchant services and related monetization create several ways to extract value from the same consumer relationship. Freight serves a different logistics customer and has different accounting and competitive dynamics.
For investors, the crucial distinction is between transaction value and recognized revenue. A change in whether an arrangement is recorded gross or net can alter reported revenue without an equivalent change in consumer activity. Consequently, bookings, transaction frequency and profit per unit of activity deserve joint attention. Treating revenue divided by bookings as a universal commission rate would mix different businesses and accounting treatments.
Business structure
|
Business
|
Q2 revenue, USD million
|
Q2 bookings, USD million
|
Q2 segment operating income, USD million
|
Economic role
|
|
Mobility
|
7,363
|
28,988
|
2,215
|
Ride matching; primary profit engine
|
|
Delivery
|
5,245
|
27,463
|
1,055
|
Meals, grocery and retail; frequency and merchant monetization
|
|
Freight
|
1,583
|
1,571
|
-24
|
Freight brokerage; gross accounting prevents take-rate comparisons
|
|
Corporate G&A / Platform R&D
|
—
|
—
|
-1,103
|
Shared overhead deducted from segment profit
|
Segment operating income is a management metric, not consolidated GAAP operating income. The segment amounts and shared overhead sum to USD 2,143 million, matching non-GAAP operating income. Freight revenue can exceed bookings because definitions and gross recognition differ; the ratio is not a meaningful marketplace take rate.
Core operating metrics and changes
|
Operating indicator
|
Q2 2025
|
Q2 2026 / latest event
|
Interpretation
|
|
MAPCs, million
|
180
|
208
|
Consumer reach
|
|
Trips, million
|
3,268
|
3,867
|
Demand volume
|
|
Gross Bookings, USD million
|
46,756
|
58,022
|
Underlying activity
|
|
ezCater agreement
|
—
|
October 6; USD 2.3 billion cash
|
Pending; not included in Q2
|
|
Q3 guidance / earnings date
|
—
|
USD 58.25–60.25 billion bookings; November 4
|
Management guidance; not consensus
|
The main commercial opportunity is to increase engagement without repeatedly paying to reacquire the same customer. Enterprise catering adds procurement relationships, scheduled orders and service requirements that differ from individual meal delivery. Uber can potentially connect those relationships to its existing consumer and business channels, but a large order also requires coordinated preparation, transport and dependable delivery windows. Higher order value does not automatically mean a higher return on invested capital.
The September Costco expansion brought nearly 600 locations across 47 states onto Uber Eats, versus coverage in 17 states previously. Our inference is that broader selection can reduce the need for a consumer to switch apps for grocery purchases. Membership discounts may help adoption but also create acquisition costs; the appropriate test is retained orders and contribution after promotions expire.
ezCater's disclosed average order value exceeds USD 400 and its network includes more than 140,000 restaurants. The transaction is expected to close in the coming months, subject to approval and customary conditions. Its announced non-GAAP operating profitability supports strategic plausibility, but no profit amount or revenue figure was disclosed in the acquisition release. We therefore avoid constructing a purchase P/E, revenue multiple or precise EPS uplift.
Management's Q3 bookings guidance is the relevant near-term yardstick. A new acquisition announced in October cannot explain Q3 organic transaction growth, and the headline growth of a later consolidated group would need an acquired-versus-existing-business bridge. The November earnings release should be evaluated on existing demand, profit conversion and funding plans separately.
3. Fundamental Quality
|
Financial measure
|
Q2 2025
|
Q2 2026
|
Assessment
|
|
Revenue, USD million
|
12,651
|
14,191
|
12.2% growth, calculated
|
|
GAAP operating income, USD million
|
1,450
|
1,890
|
13.32% latest revenue margin, calculated
|
|
GAAP net income / diluted EPS
|
USD 1,355 million / USD 0.63
|
USD 2,394 million / USD 1.17
|
Investment marks distort recurring earnings
|
|
Non-GAAP EPS
|
USD 0.60
|
USD 0.81
|
35% growth
|
|
Operating cash flow, USD million
|
2,564
|
2,862
|
Cash earnings remain substantial
|
|
Capex, USD million
|
89
|
70
|
Calculated as operating cash flow less FCF
|
|
FCF, USD million
|
2,475
|
2,792
|
12.8% growth, calculated
|
|
Cash plus short-term investments, USD million
|
7,633 at December 31, 2025
|
5,391 at June 30, 2026
|
Restricted balances excluded
|
|
Debt carrying value, USD million
|
10,521 at December 31, 2025
|
12,723 at June 30, 2026
|
Includes current and non-current debt
|
The historical comparison uses matched quarters for operating results and separately labeled balance-sheet dates. FCF equals operating cash flow less purchases of property and equipment. All calculated ratios use disclosed amounts; rounded headline growth can differ slightly. GAAP and non-GAAP figures answer different questions and are not interchangeable.
Growth quality is strong; cash conversion is good; the balance sheet is serviceable but faces rising demands; capital allocation is the weak point in the visibility of the investment case. Marketplace scale becomes valuable when incremental demand supports utilization, partner availability and recurring engagement. The economic benefit can disappear if every additional trip requires a matching increase in incentives or customer support costs.
A reproducible business-to-value transmission chain
Start with Q2's 3.867 billion Trips and USD 58.022 billion bookings. The calculated average is USD 15.004 per Trip. Assume, solely for a sensitivity, that Trips rise 10% and average bookings per Trip remain fixed. Incremental quarterly bookings would be USD 5.8022 billion. Holding the consolidated recognized revenue-to-bookings ratio at 14.191 / 58.022 = 24.458%, incremental revenue would be USD 1.4191 billion.
Assume those additional bookings produce incremental FCF at 3–5% of bookings, a deliberately conservative range below or near Q2's calculated consolidated 4.812% FCF-to-bookings ratio. Incremental quarterly FCF becomes USD 174.1–290.1 million; a four-quarter run rate is USD 696.3–1,160.4 million. At a fixed illustrative 15x FCF multiple, that supports USD 10.44–17.41 billion of additional equity value, about 7.5–12.4% of current capitalization. This is an analytical sensitivity, not a forecast: it assumes stable mix, accounting, working capital, share count and capital needs, and does not include acquisition costs.
The chain identifies what to monitor. Higher transactions create value only if monetization remains adequate and incremental cash margins survive competition. Organic FCF per share after the capital needed to maintain the competitive position is the single most important variable. Acquired growth should not be substituted for that measurement.
Cash available to the shareholder
H1 operating cash flow was USD 5.213 billion and capex USD 135 million, producing USD 5.078 billion FCF. H1 SBC was USD 1.023 billion. An illustrative subtraction of SBC gives USD 4.055 billion, roughly 20% below reported FCF; this is an economic dilution sensitivity, not a company-defined cash-flow measure. Buybacks and share issuance must be examined together rather than counting repurchase spending as proof of per-share value creation.
June unrestricted liquidity of USD 5.391 billion sits against debt carrying value of USD 12.723 billion. Restricted insurance assets cannot simply be redeployed to fund acquisitions. The low reported capex burden makes the current operating model attractive, but investments and acquisition payments reside elsewhere in the cash-flow statement. A shift toward financing vehicles or supporting autonomous infrastructure could change that profile without immediately showing up as weaker marketplace operating margins.
As a separate funding sensitivity, USD 2.3 billion for ezCater is about 22.8% of TTM FCF. This ratio measures affordability, not return. If a hypothetical USD 10 billion funding need carried a 5–7% annual cash interest cost, it would consume USD 500–700 million before tax, or about 5.0–6.9% of the current TTM FCF base. Neither the financing amount nor rate is a forecast. Acquired operating cash flows could offset the burden; their inclusion requires a documented consolidated financing and earnings bridge.
Delivery Hero consideration, earlier stake purchases and multi-year AV commitments must not be blindly added into a single imminent cash bill. Their scope, timing and possible overlap differ. Nevertheless, their coexistence means management's allocation decisions now matter as much as the growth of the existing marketplace.
4. Industry and Competitive Landscape
The relevant industry is local transaction intermediation and fulfillment. Demand is constrained by household affordability, merchant economics, courier supply and local regulation. Digital matching can make those resources more productive, but technology does not eliminate physical delivery costs. The value chain includes demand acquisition, payments, dispatch, fulfillment and, increasingly, autonomous technology and fleet financing.
Network effects are local: a large global user base does not guarantee fast pickup in a particular neighborhood. The strongest economic mechanism is sufficient density on both sides of a marketplace to improve service while spreading fixed costs. That is why geographic expansion and product breadth must be evaluated through unit economics rather than country counts.
|
Arena
|
Verified scale / evidence
|
Competitive mechanism
|
Valuation implication
|
|
Mobility distribution
|
Uber Mobility bookings USD 28.988 billion; Lyft USD 5.5 billion
|
Local density, availability and enterprise demand
|
Broad distribution can preserve relevance with AV supply
|
|
Delivery marketplaces
|
Uber Delivery bookings USD 27.463 billion; DoorDash GOV USD 33.078 billion
|
Selection, membership, ads and fulfillment reliability
|
Scale does not prove equivalent margins
|
|
Southeast Asia
|
Grab On-Demand GMV USD 6.5 billion
|
Regional ecosystems and local execution
|
Acquired footprint cannot be treated as uncontested growth
|
|
Autonomous supply
|
Supervised Wayve launch in London; driverless Apollo Go in Dubai
|
Technology owners and distributors negotiate economics
|
Partner count cannot establish durable take rates
|
|
Workplace meals
|
ezCater TTM bookings above USD 2.5 billion
|
Enterprise procurement, recurring meals, service reliability
|
Acquisition return must exceed funding and integration costs
|
No unified global market-share percentage is inferred from these figures. Total Uber bookings include Mobility, Delivery and Freight; competitor definitions and geographic footprints differ. The table establishes observable scale and mechanisms, not a directly comparable share ranking.
Three competitors against the target
|
Company / scope, Q2 2026
|
Revenue, USD million
|
Transaction value, USD billion
|
Value growth, reported YoY
|
Profit metric / comparability
|
|
Uber, consolidated
|
14,191
|
58.022
|
24%
|
Adjusted EBITDA USD 2,819 million; 4.86% of bookings, calculated
|
|
Lyft, consolidated
|
about 1,800
|
about 5.5
|
23%
|
Adjusted EBITDA USD 177.2 million; 3.2% of bookings
|
|
DoorDash, consolidated
|
4,454
|
33.078
|
36%
|
Adjusted EBITDA USD 914 million; 2.76% of GOV, calculated
|
|
Grab, group / On-Demand
|
997
|
about 6.5
|
21%
|
Group Adjusted EBITDA USD 168 million; banking included in group results
|
All periods are Q2 2026, but comparability remains approximate. Lyft rides, DoorDash orders and Uber Trips differ. Grab On-Demand GMV excludes parts of its group revenue and group earnings scope. Adjusted EBITDA also excludes company-specific items, making margin comparisons descriptive rather than proof of superior normalized returns. DoorDash growth includes an expanded acquired footprint, so its 36% headline increase is not automatically a measure of organic share capture.
Uber is a net beneficiary of marketplace consolidation and product expansion in the base case, but it is not winning every market. DoorDash is a winner in delivery scale and monetization opportunity; its transaction value means Uber cannot treat local commerce as an uncontested extension. Grab is a winner in regional engagement and profitability progression, showing why local incumbents remain formidable. Lyft is improving and remains viable, but it loses relative global breadth and cross-product leverage against Uber. That is a strategic disadvantage, not a prediction of financial distress.
The AV outcome is especially dependent on bargaining power. A technology supplier with differentiated service and its own consumer distribution may demand a larger share of the economics. Uber brings demand aggregation and dispatch; the supplier brings scarce autonomous capability and vehicles. Both can add value. The investment question is whether Uber retains attractive profit after compensating the owners and financiers of those assets.
The London Wayve service launched with a trained driver onboard. Dubai's Apollo Go launch is fully driverless in selected areas. These are distinct stages of commercialization; supervised launches should not be counted as evidence that driver costs have already disappeared. Our base case preserves existing Mobility cash earnings and assigns limited additional AV value until contracted returns, utilization and liability allocation become visible.
For ezCater, the potential advantage is enterprise workflow integration and reliable group fulfillment. The potential loser is a standalone intermediary that has to buy demand repeatedly while a broader platform cross-sells to existing relationships. This is our strategic inference, not a verified market-share result. Uber still has to preserve service quality and merchant economics while integrating the acquired product.
5. Key Risks
-
AV bargaining power erodes Mobility economics. Trigger: autonomous partners demand larger revenue shares or prioritize their own distribution. Transmission: lower retained profit per booking and additional guarantees reduce FCF, causing a lower equity multiple even as Trips rise.
-
Acquisition returns trail the capital cost. Trigger: integration costs, weak retention or delays prevent purchased earnings from covering financing and amortization burdens. Transmission: consolidated revenue grows while per-share economic returns weaken; deleveraging competes with repurchases.
-
Reported FCF overstates sustainable owner earnings. Trigger: SBC dilution persists or insurance and working-capital cash benefits reverse. Transmission: cash available after maintaining share count and settling obligations falls below headline FCF, making the apparent 7.22% yield less attractive.
-
Consumers respond to affordability pressure. Trigger: booking growth falls below the lower end of guidance despite promotion spending. Transmission: lower frequency weakens density and spreads support and technology costs across fewer transactions, compressing profit conversion.
-
Labor, insurance or regulatory costs rise. Trigger: binding changes to contractor treatment, reserve requirements or liability obligations. Transmission: direct costs increase, partner supply becomes more expensive, and price rises can weaken demand. Geographic diversification does not prevent a concentrated local shock.
-
Delivery competition forces renewed subsidies. Trigger: merchant or consumer incentives outgrow incremental gross profit. Transmission: acquired selection and grocery breadth fail to generate sufficient contribution; earnings quality deteriorates before headline bookings do.
-
Transaction timing changes capital needs. Trigger: regulatory remedies, a revised offer schedule or funding-market deterioration alters an acquisition's conditions. Transmission: cash timing, interest costs and expected synergies move, invalidating standalone valuation assumptions. November 5 is an acceptance deadline, not a confirmed cash settlement date.
The principal valuation failure would be structural damage to retained cash per transaction. A share-price decline alone does not invalidate the thesis, while a headline acquisition announcement alone does not strengthen it. The evidence must connect operating progress to economic cash generation per share.
6. Monitoring Checklist
These thresholds are analyst-defined monitoring rules unless identified as management guidance; they are not predictions.
-
November 4 Q3 results: bookings at or above USD 58.25 billion would satisfy management's current lower bound; below it would weaken the demand assessment. Compare the outcome on the same scope and currency basis.
-
Non-GAAP EPS: management's USD 0.84–0.88 range provides an earnings conversion test. Below USD 0.84 alongside sustained booking growth would shift attention to cost pressure; reconciliation matters more than a headline beat.
-
Quarterly FCF conversion: sustaining FCF/bookings above 4% would support the cash thesis; below 3% for two quarters would require a working-capital, insurance and capital-spending review. Do not annualize one favorable quarter without checking seasonality.
-
Capital allocation and financing: require separate disclosure of acquisition payments, incremental debt, interest expense and vehicle commitments. Debt materially exceeding management's stated below-2x gross leverage intention for the Delivery Hero transaction would weaken the financing case, subject to its eventual defined denominator.
-
November 5 Delivery Hero acceptance deadline: monitor tender status and regulatory progress; the stated settlement expectation is H2 2027. A deadline passing does not mean the business is consolidated or consideration has been paid.
-
ezCater integration and returns: look for disclosed revenue, operating income and integration costs. Until those are available, book no numerical synergy in the base case. Evidence of margin accretion after recurring service costs would strengthen the rationale.
-
AV commercialization: track utilization, retained profit and funding guarantees alongside deployment milestones. The year-end aspiration of as many as 15 cities helps measure rollout, but a larger city count with weakening unit economics would not support a higher valuation.
-
Per-share economics: require share-count reduction and cash growth to be assessed jointly. Dilution above 2% annually without compensating cash growth would weaken the value conclusion, even if total group earnings increase.
Material data boundaries: ezCater's detailed financial statements and transaction return model were not disclosed in the release. AV partner contracts and unit economics are not available in the cited sources. The stock valuation uses October 7 secondary market data; the LBank trading page is used to verify coverage, and its cached token quote is not a verified live equity price. No analyst consensus, formal rating or personalized trading instruction is used.
7. Sources
-
-
Uber Announces Results for Second Quarter 2026 (https://investor.uber.com/news-events/news/press-release-details/2026/Uber-Announces-Results-for-Second-Quarter-2026/default.aspx) — August 5, 2026; quarter ended June 30; GAAP and non-GAAP identified separately.
-
Uber Form 10-Q — June 30, 2026 (https://www.sec.gov/Archives/edgar/data/1543151/000154315126000032/uber-20260630.htm) — SEC primary filing; H1 cash flow, balance sheet and accounting checks.
-
Q2 2026 Prepared Remarks (https://investor.uber.com/files/doc_earnings/2026/q2/transcript/Uber-Q2-26-Prepared-Remarks.pdf) — August 5, 2026; management outlook and capital intentions, not guarantees.
-
Uber Announces Acquisition Offer for Delivery Hero (https://investor.uber.com/news-events/news/press-release-details/2026/Uber-Announces-Acquisition-Offer-for-Delivery-Hero/default.aspx) — July 16, 2026; offer terms and conditional financing expectations.
-
-
Costco Expands Nationwide Delivery on Uber Eats (https://investor.uber.com/news-events/news/press-release-details/2026/Costco-Expands-Nationwide-Delivery-on-Uber-Eats/default.aspx) — September 16, 2026; distribution expansion, no incremental profit forecast.
-
-
-
-
Lyft Reports Strong Q2 2026 Results (https://investor.lyft.com/news-events-presentations/press-releases/detail/202/lyft-reports-strong-q2-2026-results) — Quarter ended June 30, 2026; bookings and Adjusted EBITDA.
-
-
Grab Reports Record Second Quarter 2026 Results (https://s205.q4cdn.com/179588156/files/doc_financials/2026/q2/Grab-Reports-Record-Second-Quarter-2026-Results.pdf) — August 4, 2026; On-Demand GMV and group earnings have different scopes.
-
-
-
-
UBERON/USDT Spot Trading | LBank (https://www.lbank.com/trade/uberon_usdt) — Opened October 8, 2026; chart, pair and Buy/Sell controls visible; cached quote excluded from stock valuation.
-
-
-
-