Author: LBank Research Analyst: Ludo
Disclaimer: This report is compiled and analyzed from publicly available information and is intended solely for information sharing and research discussion. It does not constitute investment advice, a securities recommendation, a trading instruction, or any guarantee of returns. The company operations, valuations, market prices, and consensus expectations discussed herein may change over time. Readers should independently verify the data and make their own decisions.
1. Core Conclusion
Overall judgment: Lumentum Holdings Inc. is a strong beneficiary of AI optical connectivity, but its valuation is stretched and the risk-reward is negative at the September 29 closing price of USD 973.49. The decisive variable is whether new optical architectures deliver sustained diluted EPS growth beyond the current guidance run rate while cash conversion improves.
-
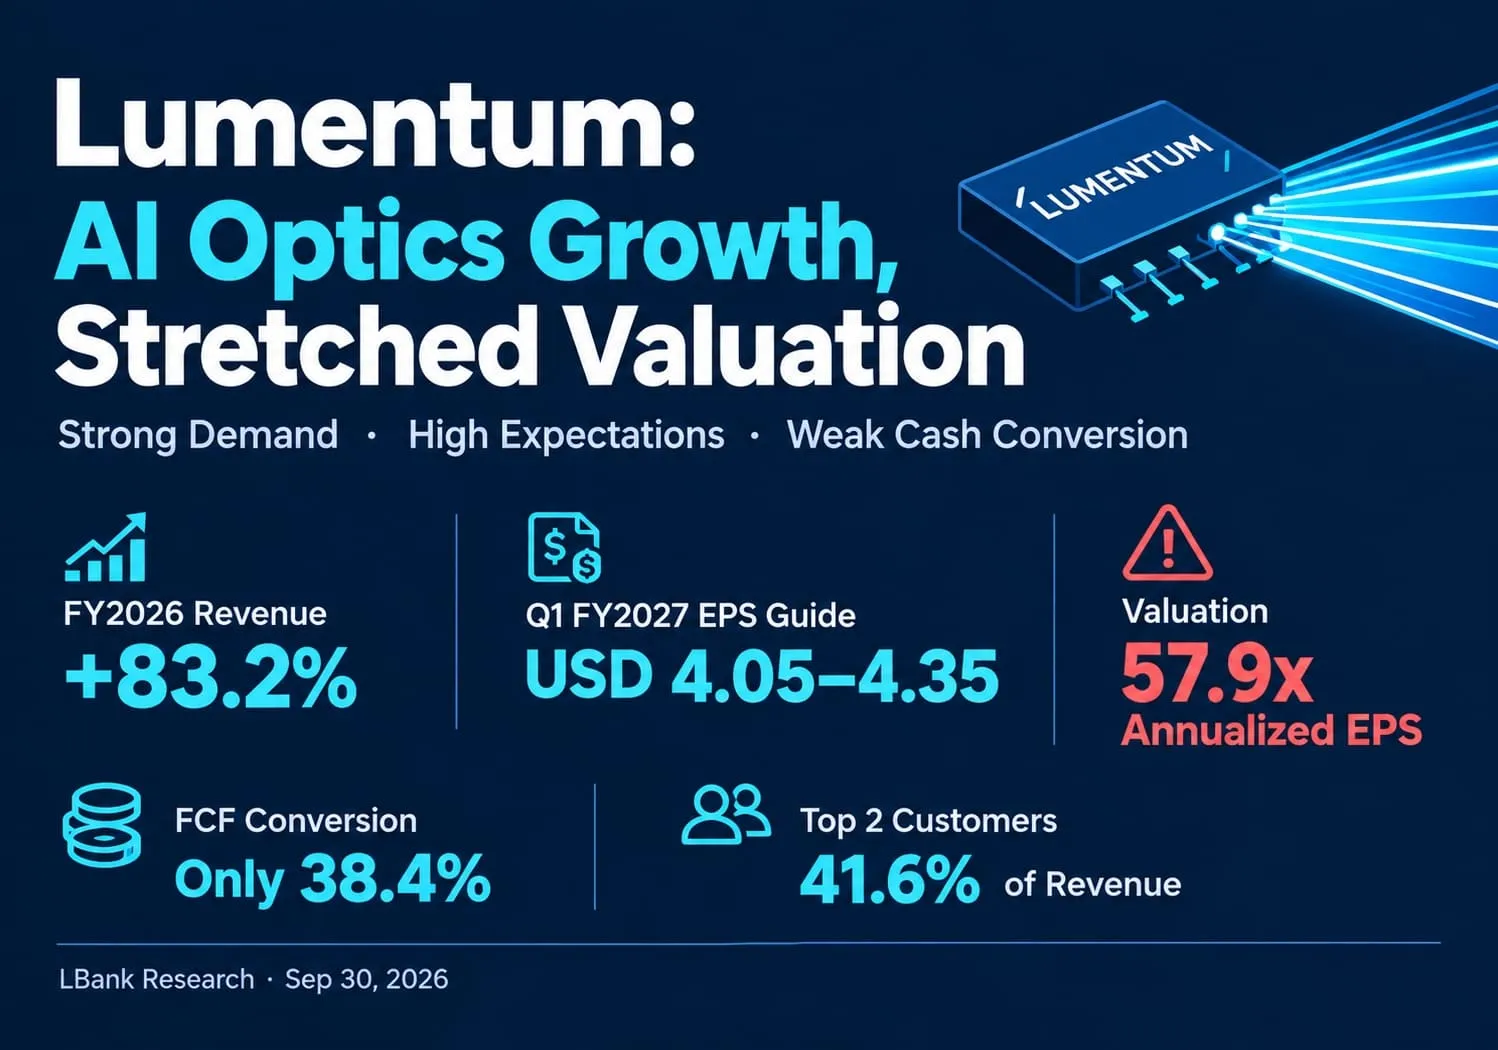
Growth supports a premium. FY2026 revenue was USD 3.014 billion, up 83.2%; Q4 growth reached 109.3%. This is a meaningful operating expansion. Our interpretation is that investors should value the business above a mature optical supplier, while still allowing for customer purchasing cycles and competing capacity.
-
The near-term earnings hurdle is already high. Q1 FY2027 guidance is USD 1.225–1.275 billion revenue, 39.5%–40.5% non-GAAP operating margin and USD 4.05–4.35 non-GAAP EPS. Midpoints imply USD 500 million quarterly operating profit and USD 16.80 annualized EPS. Annualization is a mechanical reference, not company full-year guidance or analyst consensus.
-
ECOC adds product opportunities beyond the current revenue base. The September 21 announcements cover an eight-wavelength DWDM ELSFP module, with initial availability expected in the first half of calendar 2027, and a 1060 nm VCSEL demonstration with Qualcomm and Corning. These strengthen the technology thesis. We assign no incremental revenue to either demonstration without disclosed qualification, volume and pricing evidence.
-
The share price requires growth beyond that already strong run rate. USD 973.49 divided by FY2026 adjusted EPS of USD 8.67 is 112.3 times; divided by USD 16.80 is 57.9 times. At an illustrative 45 times multiple, maintaining this price requires annual EPS of USD 21.63, 28.8% above the guidance run rate. This is the central expectations gap, rather than a claim that the business has stopped growing.
-
Cash conversion remains the constraint on earnings quality. FY2026 operating cash flow of USD 751.4 million less capex of USD 451.3 million gives USD 300.1 million FCF, or 38.4% of adjusted net income. We would soften the negative valuation view if conversion exceeds 50% while diluted earnings continue to rise. Earnings growth financed by persistently larger capital requirements deserves a lower multiple than growth that releases cash.
Research scenarios, not price targets or consensus. To separate execution from valuation, use a common illustrative 12-month repricing horizon. A downside EPS assumption of USD 12.96 at 35 times gives USD 453.60, or negative 53.4% versus the reference price. A base assumption of USD 16.80 at 45 times gives USD 756.00, or negative 22.3%. An upside assumption of USD 21.60 at 55 times gives USD 1,188.00, or positive 22.0%. The first and third EPS inputs are independently chosen sensitivities, respectively 22.9% below and 28.6% above the reference run rate; they are not management forecasts. No probabilities or probability-weighted target are assigned.
The multiples express a judgment about durability: 35 times allows for a weaker cycle, 45 times retains a substantial growth premium, and 55 times assumes persistent technology scarcity. They are not peer-median multiples. A different required return or growth duration would change them. At 45 times, merely meeting the current annualized earnings reference leaves downside; at 55 times, even substantial earnings expansion produces a more modest return than the operating growth rate. The upside case is plausible, but the starting price already relies heavily on it.
A reproducible operating sensitivity connects demand to valuation. Suppose qualified optical shipment units rise 20% and realized ASP falls 5%, with mix held constant. Revenue grows by 1.20 × 0.95 − 1 = 14%. Applying that assumption to the Q1 midpoint gives quarterly revenue of USD 1.425 billion. Holding non-GAAP operating margin at 40% gives USD 570 million operating income, versus USD 500 million at the starting point. With tax, non-operating items and diluted shares held constant, proportional scaling of USD 4.20 EPS gives USD 4.788 quarterly and USD 19.152 annualized. At 45 times, the implied share value is USD 861.84, still 11.5% below the reference price. These are sensitivity assumptions, not disclosed shipment guidance. They show why favorable industry demand alone does not guarantee a favorable equity return.
The main objection to our cautious valuation is that quarterly annualization understates a business still accelerating. That objection is valid. It is why the upside scenario explicitly allows higher earnings. The burden of proof is repeated profitable shipment growth, rather than the number of product demonstrations. Margin expansion can add further upside, but a model that simultaneously assumes sustained rapid units, favorable pricing, higher margins and no dilution embeds several correlated successes.
2. Company Overview, Business Mix, and Core Operating Metrics
Lumentum is a photonics supplier positioned between semiconductor-grade laser manufacturing and optical-network systems. Its products enable data to move inside AI clusters, between data centers, across metro and long-haul networks, and through submarine systems.
Customers include cloud and network service providers, AI infrastructure operators, and network equipment manufacturers. Most sales occur through purchase orders rather than binding long-term volume commitments, which creates both rapid upside during capacity shortages and meaningful cancellation or mix risk when customers change architectures.
The Components portfolio includes laser chips and assemblies, datacom and telecom transmission components, and products supporting intra-data-center, DCI, long-haul, and undersea links. Our inference is that this is the core economic engine because higher-speed 200G-per-lane products, strong factory utilization, and scarce high-power lasers lift mix and absorption. Components represented 66.5% of FY2026 revenue and generated USD 889.3 million of the company's USD 1.369 billion year-over-year revenue increase.
Systems combines cloud optical transceivers and OCS products. Line subsystems are included in the Components data-transport discussion in the annual filing. Cloud transceiver revenue increased by more than 173% in FY2026 as shipment volumes rose, although lower average selling prices partly offset growth. OCS contributed more than USD 90 million in its initial shipment phase. These systems give Lumentum more content per AI architecture, but they also expose it to module pricing, qualification schedules, and manufacturing-ramp risk.
Separate product-type operating profit is not disclosed, so revenue mix must not be presented as a measured profit split. The company also participates in industrial and advanced-technology applications through ultrafast lasers, precision materials processing, and 3D-sensing emitters. Lumentum no longer discloses this as a separate reportable revenue segment; the financial statements are organized by Components and Systems. That reporting structure limits precise end-market profitability analysis, so product type is the most auditable business-mix lens.
|
FY2026 product type
|
Products and customers
|
Revenue
|
YoY growth
|
Share of revenue
|
Key KPI
|
Research judgment
|
|
Components
|
Laser chips and assemblies; datacom, telecom, DCI, long-haul, and undersea products sold to cloud operators and NEMs
|
USD 2,005.6m
|
79.7%
|
66.5%
|
Laser products drove 78% of Components dollar growth; 200G lane mix supported ASP
|
Primary moat and margin pool; strongest exposure to laser scarcity
|
|
Systems
|
Cloud transceivers, OCS, and integrated optical systems
|
USD 1,008.4m
|
90.7%
|
33.5%
|
Cloud transceivers grew more than 173%; OCS exceeded USD 90m
|
Fastest system-level expansion, with more pricing and ramp risk
|
|
Total
|
Integrated photonics portfolio across cloud, AI, carrier, and industrial applications
|
USD 3,014.0m
|
83.2%
|
100.0%
|
FY2026 GAAP gross margin 41.7%
|
A genuine portfolio-wide inflection, not a single-product spike
|
The best asset is the vertically integrated laser platform: it participates across pluggable modules, OCS, CPO laser sources, and future NPO or ELS deployments. The weak point is contractual visibility. Customer forecasts are not equivalent to committed backlog, and the two largest customers account for more than two-fifths of revenue. High utilization creates operating leverage today but can reverse quickly if a major architecture changes or customers dual-source.
Core Operating Metrics and Changes
This September 30 update incorporates the September 21 ECOC product announcements and the September 29 equity close. The latest financial period verified remains Q4 FY2026, ended June 27, with results released August 11. No newer quarterly results or revised company financial guidance were identified in the official releases reviewed. The stock rose 5.66% on September 29 and is 5.9% above the September 16 reference used in our earlier coverage.
The ELSFP announcement matters because a serviceable external laser source gives Lumentum a route into CPO and NPO architectures even as packaging changes. Our inference is that portability across architectures reduces dependence on one module design. However, initial availability in 2027 is an engineering milestone; broad deployment still requires qualification and economic acceptance by customers.
We do not pull this potential revenue into the September quarter.
The VCSEL demonstration adds an alternative route into short-reach optical connectivity. Its relevance is diversification of technology exposure, rather than immediate evidence of market share. A supplier can participate in multiple architectures while still facing pricing pressure within each. Neither ECOC release provides a quantified commercial order that would justify lifting this report's earnings assumptions.
|
Metric or event
|
Latest value
|
Comparison
|
Basis
|
Investment meaning
|
|
Q4 FY2026 revenue
|
USD 1,006.3m
|
109.3% YoY; 24.5% QoQ
|
GAAP reported revenue
|
Broad AI-optics demand and capacity utilization are accelerating together
|
|
Q4 margins
|
47.4% GAAP GM; 27.8% GAAP OM
|
Plus 1,410 bps and 2,950 bps YoY
|
GAAP
|
Factory absorption and mix have transformed earnings power
|
|
Q4 adjusted margins
|
50.4% GM; 36.6% OM
|
Plus 1,260 bps and 2,160 bps YoY
|
Company non-GAAP
|
Near-term economics resemble a scarce semiconductor platform more than legacy optics
|
|
Q1 FY2027 guidance
|
USD 1,225–1,275m revenue
|
24.2% QoQ at midpoint
|
Company outlook
|
The midpoint implies a USD 5.0bn annualized revenue run rate
|
|
Q1 adjusted profitability guide
|
39.5%–40.5% OM; USD 4.05–4.35 EPS
|
Above Q4 adjusted OM and EPS
|
Company non-GAAP outlook
|
Raises the earnings base but also establishes a high hurdle for subsequent quarters
|
|
September 29 close
|
USD 973.49
|
5.66% daily increase
|
Secondary market data
|
Valuation expansion, not only earnings growth, now dominates downside sensitivity
|
The Q4 GAAP net loss of USD 7.2 billion is not evidence of operating collapse. It primarily reflects a USD 7.8 billion one-time, non-cash debt-extinguishment loss caused by equitizing convertible notes. The economic cost still matters because common shares outstanding rose to 88.6 million from 69.8 million, and NVIDIA's 2.9 million preferred shares convert one-for-one. Non-GAAP earnings better describe current operations, while per-share valuation must recognize the much larger equity base.
3. Fundamental Quality
|
Item
|
FY2024
|
FY2025
|
Q4 FY2026
|
FY2026
|
Research judgment
|
|
Revenue
|
USD 1,359.2m
|
USD 1,645.0m
|
USD 1,006.3m
|
USD 3,014.0m
|
Growth is exceptionally strong and product-wide
|
|
GAAP gross margin
|
18.5%
|
28.0%
|
47.4%
|
41.7%
|
Utilization and mix created a structural-looking step-up
|
|
GAAP operating margin
|
Negative 31.9%
|
Negative 10.9%
|
27.8%
|
17.4%
|
Fixed-cost leverage is powerful but cyclical
|
|
Non-GAAP EPS
|
Not used
|
USD 2.06
|
USD 3.23
|
USD 8.67
|
Best measure of current earnings trend, but excludes meaningful items
|
|
Operating cash flow
|
USD 24.7m
|
USD 126.3m
|
Not separately disclosed
|
USD 751.4m
|
Strong improvement, partly absorbed by working capital
|
|
Free cash flow
|
Negative USD 108.3m
|
Negative USD 104.7m
|
Not separately disclosed
|
USD 300.1m
|
Positive inflection, but only 10.0% of revenue
|
|
Capital expenditure
|
USD 133.0m
|
USD 231.0m
|
Not separately disclosed
|
USD 451.3m
|
Necessary for capacity, but raises peak-cycle cash risk
|
|
Cash plus short-term investments / debt
|
Not shown
|
USD 877.1m / USD 2,573.2m
|
USD 2,738.4m / USD 1,637.4m
|
USD 2,738.4m / USD 1,637.4m
|
Accounting net cash improved, but convertible dilution was substantial
|
Note: FCF equals operating cash flow less purchases of property, plant, and equipment. FY2024 and FY2025 FCF are calculated on the same basis. Q4 cash and debt columns use the June 27, 2026 balance sheet because separate quarterly cash-flow detail was not provided in the release.
Growth and margins. Revenue quality is strong because both product categories accelerated, laser products drove most Component growth, and cloud transceiver shipments expanded sharply. FY2026 gross margin improved by 1,370 basis points. The company attributes about 54% of gross-profit dollar improvement to lower manufacturing cost as a percentage of revenue, 29% to favorable mix, and 17% to lower intangible amortization. The first two drivers are operational; the third is accounting-related.
Cash flow and investment. Cash generation improved dramatically, but receivables rose USD 270.4 million and inventory rose USD 228.4 million as the company built for demand. Capex nearly doubled to USD 451.3 million. That is rational if Q1's growth persists, but any customer pause would simultaneously reduce revenue, pressure factory absorption, and strand inventory.
Balance sheet and capital allocation. Cash plus short-term investments exceeded carrying debt by about USD 1.10 billion at year-end. However, this improvement was financed partly through USD 2.0 billion of preferred stock sold to NVIDIA and new 2032 convertible notes. Common shares outstanding increased 26.9% year over year. The capital strengthened supply and reduced near-term liquidity risk, but existing holders paid through dilution and a more complex per-share claim.
Convertible debt complicates enterprise-value comparisons. The annual filing classifies the notes as current because holders can convert, and notes require cash settlement of principal while excess conversion value may involve cash or shares. As of August 14, requests covered USD 757.8 million principal. Accounting net cash therefore does not mean all cash is discretionary, and book debt understates the economic option value embedded in the notes. This report uses explicitly labeled per-share earnings sensitivities instead of presenting an apparently precise current fully diluted EV. Future diluted share counts and financing choices remain material to the result.
Fundamental conclusion. Fundamental quality is strong: growth, margins, and liquidity all improved. The single most important variable is whether the Q1 FY2027 margin structure persists as new OCS, 1.6T, CPO, ELS, and NPO programs scale. At today's valuation, stability is insufficient; sustained upside requires continued volume growth without the historical optical-industry ASP decline overwhelming mix.
4. Industry and Competitive Landscape
Lumentum competes in the optical connectivity value chain, from lasers and photonic components to transceivers and switching systems. AI clusters require higher bandwidth, lower power per bit, and increasing optical reach. The profit pool is migrating toward scarce laser capacity, high-speed modules, advanced packaging, and optical switching. Public companies disclose different mixes, so revenue growth and gross margin are more reliable than claimed market shares.
|
Competitive dimension
|
Lumentum position
|
Scale metric and limitation
|
Key competitors or substitutes
|
Investment implication
|
|
Demand and customers
|
Direct exposure to hyperscalers, AI infrastructure providers, and NEMs
|
Top two customers were 41.6% of FY2026 revenue; identities are not disclosed
|
Coherent, Ciena, vertically integrated hyperscalers
|
Fast qualification wins create scale, but concentration reduces durability
|
|
Laser and component technology
|
High-power lasers, 200G lane products, CPO laser sources, ELS, and NPO engagements
|
Laser growth contribution is disclosed, but market-share denominator is not
|
Coherent and Asian photonics suppliers
|
Scarcity and vertical integration support premium margins
|
|
Modules and systems
|
Cloud transceivers and OCS
|
Cloud transceiver revenue grew more than 173%; OCS exceeded USD 90m
|
Coherent, Ciena, and customer-designed alternatives
|
Expands content, but brings ASP and execution risk
|
|
Manufacturing capacity
|
Internal laser manufacturing plus contract manufacturing
|
FY2026 capex was USD 451.3m; yield and capacity data are not separately disclosed
|
Coherent's scale and Fabrinet's outsourced manufacturing platform
|
Capacity is a moat only while demand and yield stay high
|
|
Valuation context
|
Scarcity premium supported by strong earnings growth and ECOC optionality
|
112.3 times FY2026 adjusted EPS; 57.9 times Q1 midpoint EPS annualized
|
Broader optical peers grow rapidly but trade on different product mixes
|
The stock requires category dominance, not merely industry participation
|
|
Company
|
Latest comparable period
|
Revenue or KPI
|
Growth and margin
|
Operating and investment status
|
Competitive conclusion
|
|
Lumentum
|
Q4 FY2026, ended June 27
|
USD 1,006.3m revenue
|
109.3% YoY; 50.4% non-GAAP GM
|
Ramping OCS, 1.6T, CPO, ELS, and NPO; FY2026 capex USD 451.3m
|
Operational winner with the best disclosed growth-margin combination
|
|
Coherent
|
Q4 FY2026, ended June 30
|
USD 2,045.5m revenue
|
33.8% YoY; 40.2% non-GAAP GM
|
Broader photonics portfolio and capacity expansion; Q1 guide USD 2.2–2.4bn
|
Scale winner and strongest direct strategic rival
|
|
Ciena
|
Q3 FY2026, ended August 1
|
USD 1,671.1m revenue
|
37.0% YoY; 46.4% adjusted GM
|
Network systems leader; FY2026 revenue guide raised to USD 6.42bn midpoint
|
Winning in optical systems, but less pure laser scarcity exposure
|
|
Fabrinet
|
Q4 FY2026, ended June 26
|
USD 1,315.8m revenue
|
44.6% YoY; 12.2% non-GAAP GM
|
Advanced optical manufacturing platform; Q1 guide USD 1.375–1.425bn
|
Manufacturing-volume winner, but structurally lower-value economics
|
Note: Periods and business mixes differ. Lumentum and Coherent sell components and systems, Ciena is weighted to networking systems and services, and Fabrinet is an outsourced manufacturing provider. Gross-margin comparisons indicate value capture, not like-for-like product profitability.
Lumentum is the near-term operating winner because its 109.3% growth and 50.4% adjusted gross margin exceed the disclosed combinations for the selected peers. Coherent remains the strongest strategic competitor because its USD 2.05 billion quarterly scale, broad photonics stack, and 34% growth can support more customer programs. Ciena is winning in optical networking systems, validating that AI bandwidth demand extends beyond intra-cluster components. Fabrinet is also winning volumes, but its 12.2% non-GAAP gross margin indicates less gross-profit capture per revenue dollar. It is the relative laggard on this metric, not an established loser in market share or shareholder returns. Manufacturing turnover and capital efficiency also matter; gross margin alone cannot rank returns on invested capital.
The sector has multiple winners; Our assessment is that Lumentum remains a net beneficiary of the industry transition, with valuation asymmetry the main equity concern. Its stock already capitalizes the company as if its current lead becomes durable category dominance. A competitor gaining laser yield, a hyperscaler internalizing module design, or pluggable ASP declines can reduce Lumentum's multiple before revenue declines.
5. Key Risks
-
Hyperscaler concentration. If either top customer reduces purchases by 10%, delays a platform, or adds a second source, revenue could fall by tens of millions of dollars before offsets. Lower volume would also reduce factory absorption, causing operating profit to fall faster than revenue.
-
Valuation compression. At 57.9 times Q1 midpoint non-GAAP EPS annualized, a result that merely meets guidance can still trigger a lower multiple. At 45 times the same USD 16.80 run rate, value falls to USD 756.00. This risk needs no earnings decline; it only requires a lower willingness to capitalize distant growth.
-
Capacity and working-capital reversal. FY2026 capex was USD 451.3 million, inventory rose USD 228.4 million, and receivables rose USD 270.4 million. If demand timing slips, FCF could turn negative while utilization and margins decline together.
-
Technology and pricing transitions. 1.6T, CPO, NPO, ELS, and OCS programs can be delayed, redesigned, or displaced. Legacy optical products typically face ASP erosion; if volume and mix no longer offset price decline, non-GAAP gross margin could fall below the 48% monitoring threshold.
-
Dilution and convertible complexity. Common shares rose from 69.8 million to 88.6 million, NVIDIA holds 2.9 million convertible preferred shares, and convertible notes retain equity-sensitive value. Further conversions or equity-funded capacity can dilute per-share earnings even while enterprise profit grows.
-
Trade and export controls. Lumentum ships 79.2% of revenue outside the United States and has stopped shipments to Huawei under export restrictions. Broader controls, tariffs, or licensing limits could restrict customers or inputs and create both revenue loss and stranded capacity.
6. Monitoring Checklist
-
Q1 FY2027 revenue: at least USD 1.225 billion supports the current operating thesis; below the low end weakens both the growth and utilization cases.
-
Non-GAAP operating margin: 40% or better confirms the target economics; below 37% would suggest mix, yield, or pricing deterioration.
-
Non-GAAP gross margin: 48% or better supports the margin thesis; below 48% weakens it. Compare this threshold only with the 50.4% Q4 non-GAAP baseline, not the 47.4% GAAP baseline.
-
OCS revenue and cloud transceiver growth: OCS should rise materially above the FY2026 base of more than USD 90 million, while cloud modules must sustain strong shipment growth without severe ASP dilution.
-
Customer concentration: a decline in the top-two share from 41.6% toward 35% would improve durability; further concentration would increase single-platform risk.
-
FCF conversion: annualized FCF should move above 50% of non-GAAP net income as working capital normalizes; persistence near FY2026's 38.4% would weaken earnings quality.
-
Peer execution: compare Coherent's Q1 revenue against USD 2.2–2.4 billion, Ciena's Q4 revenue against USD 1.70–1.80 billion, and Fabrinet's Q1 revenue against USD 1.375–1.425 billion. Broad beats validate sector demand; Lumentum-specific misses imply share or execution loss.
-
Product conversion and share count: track ELSFP initial availability in the first half of calendar 2027, subsequent paid qualifications and diluted shares. Slippage without offsetting sales weakens the upside scenario; shipment-led EPS growth above USD 5.40 per quarter would approach its USD 21.60 annualized earnings assumption.
7. Sources