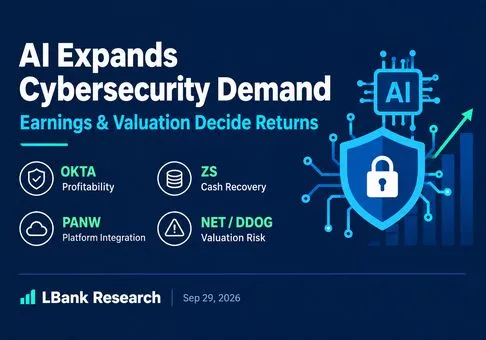
Cybersecurity Investment Map: AI Expands Demand, but Earnings and Valuation Determine Returns
Author: LBank Research Analyst: Ludo
Disclaimer: This report is compiled and analyzed from publicly available information and is intended solely for information sharing and research discussion. It does not constitute investment advice, a securities recommendation, a trading instruction, or any guarantee of returns. The company operations, valuations, market prices, and consensus expectations discussed herein may change over time. Readers should independently verify the data and make their own decisions.
1. Core Conclusion
Enterprise security demand is structurally positive, but company value depends on converting that demand into sustainable earnings and cash flow. AI agents expand identity, endpoint, network and data-control requirements while intensifying platform bundling and pricing competition. Our research priorities are OKTA for demonstrated profitability, ZS for cash-conversion recovery, and PANW for platform integration. NET and DDOG require stronger growth delivery to support their valuations.
-
Identity and runtime controls are emerging demand priorities. Cloudflare’s agent CLI, OpenAI’s withheld GPT-6.1 Astra release and the Blueprint Alliance highlight the importance of agent identity, constrained permissions and continuous monitoring. The commercial opportunity depends on paid deployment and renewal economics, rather than product-launch counts.
-
Specialist vendors and diversified technology companies have different return drivers. This report focuses on PANW, ZS, OKTA, NET and DDOG, and maps security-related businesses at twelve diversified companies. CRWD and FTNT provide industry benchmarks. Owning a security product does not mean security dominates a company’s equity performance.
-
Profit quality is diverging. OKTA reports a 13.3% GAAP operating margin. ZS is close to operating break-even but has weak quarterly cash conversion. NET’s loss includes material restructuring charges, requiring a distinction between exceptional costs and ongoing performance.
-
Some growth expectations are already reflected in demanding valuations. September 28 equity snapshots imply approximately 50.2x and 49.3x trailing sales for NET and CRWD, versus 11.5x and 9.7x for OKTA and ZS. These differences reflect distinct growth expectations; a lower multiple alone does not establish undervaluation.
-
The research focus should move from incident counts to cash generation per share. New contracts, organic growth, customer retention and FCF per share provide stronger evidence of shareholder value creation than short-term headline intensity.
The research date is September 29, 2026. Coverage spans enterprise security, cloud and application protection, identity management, and related governance and recovery businesses.
2. Company Overview, Business Mix, and Core Operating Metrics
Cybersecurity company map
The research universe is grouped by business exposure, with diversified technology suppliers presented separately to distinguish security demand from other operating drivers.
|
Ticker
|
Company
|
Security exposure
|
|
PANW
|
Palo Alto Networks, Inc.
|
Network / cloud / SOC / identity
|
|
ZS
|
Zscaler, Inc.
|
Zero Trust / SSE / SASE
|
|
OKTA
|
Okta, Inc.
|
Workforce / customer / agent identity
|
|
NET
|
Cloudflare, Inc.
|
Application security / edge / Zero Trust
|
|
DDOG
|
Datadog, Inc.
|
Observability / cloud and application security
|
|
Ticker
|
Company
|
Diversified exposure
|
|
MSFT
|
Microsoft Corporation
|
Defender / Entra / Sentinel
|
|
GOOGL
|
Alphabet Inc.
|
Google Cloud security / Mandiant
|
|
AMZN
|
Amazon.com, Inc.
|
AWS security / IAM
|
|
CSCO
|
Cisco Systems, Inc.
|
Network security / Splunk
|
|
IBM
|
International Business Machines Corporation
|
Guardium / Verify / security services
|
|
|
Broadcom Inc.
|
Symantec / Carbon Black
|
|
ACN
|
Accenture plc
|
Cybersecurity consulting / managed services
|
|
ORCL
|
Oracle Corporation
|
Database and cloud security / Data Safe
|
|
NOW
|
ServiceNow, Inc.
|
Security Operations / governance
|
|
HPE
|
Hewlett Packard Enterprise Company
|
Networking security
|
|
DELL
|
Dell Technologies Inc.
|
Cyber recovery / data protection
|
|
CRM
|
Salesforce, Inc.
|
Agent governance / enterprise data controls
|
The core security-only group is PANW, ZS and OKTA; NET also sells infrastructure and developer services, while DDOG is primarily an observability platform with security products. The twelve diversified companies belong in a secondary watchlist, not an equal-weight pure-security index. Their security exposure is supported by the Blueprint Alliance, corporate results and the product sources in Section 7. HPE discloses quarterly security revenue of USD 281 million, only about 2.3% of total revenue, illustrating why a real security offering need not dominate a stock’s return.
Comparable operating snapshot
All amounts below are USD million. Growth is reported year over year; acquisition effects are not removed unless explicitly stated. FCF is operating cash flow less capital expenditure and applicable capitalized software, with PANW calculated on the ordinary rather than adjusted basis. Fiscal calendars and billing seasonality differ.
|
Ticker
|
Period / end
|
Revenue
|
YoY
|
GAAP op. margin
|
FCF
|
FCF margin
|
Source
|
|
PANW
|
Q4 FY26 / Jul 31
|
3,410.0
|
34%
|
5.0%
|
1,254.0
|
36.8%
|
|
|
ZS
|
Q4 FY26 / Jul 31
|
898.2
|
25%
|
-1.7%
|
60.8
|
6.8%
|
|
|
OKTA
|
Q2 FY27 / Jul 31
|
805.0
|
11%
|
13.3%
|
227.0
|
28.2%
|
|
|
NET
|
Q2 2026 / Jun 30
|
696.1
|
36%
|
-29.5%
|
56.4
|
8.1%
|
|
|
DDOG
|
Q2 2026 / Jun 30
|
1,120.0
|
36%
|
0.4%
|
279.0
|
24.9%
|
|
|
CRWD*
|
Q2 FY27 / Jul 31
|
1,470.9
|
26%
|
-2.3%
|
377.4
|
25.7%
|
|
|
FTNT*
|
Q2 2026 / Jun 30
|
2,050.0
|
26%
|
33.7%
|
966.0
|
47.1%
|
|
*CRWD and FTNT are industry benchmarks. Rounded reported inputs produce approximate margins.
3. Fundamental Quality
OKTA has the clearest current accounting-profit case among the directly relevant candidates. Quarterly GAAP operating profit was USD 107 million and FCF was USD 227 million. Revenue grew 11%, while cRPO grew 14%, suggesting forward contracted demand is stronger than recognized growth. Its appeal is execution and cash generation rather than the highest growth rate. The question is whether agent identities create incremental paid usage instead of merely extending existing contracts.
Okta Q2 FY2027 Results, August 26, 2026
ZS is the most visible cash-conversion debate. Q4 organic ARR growth was 20%, versus reported growth of 25%, with USD 141 million of ARR from Red Canary. Quarterly capital expenditure and capitalized software absorbed USD 218.5 million, leaving FCF of USD 60.8 million from operating cash flow of USD 279.3 million. Full-year FCF margin of 23.2% is more representative than annualizing this weak quarter, but spending cannot simply be ignored. Monitor whether installed capacity and integration produce monetizable demand.
Zscaler Q4 FY2026 Results, September 3, 2026
PANW has scale and cash generation, but reported growth needs an acquisition bridge. NGS ARR reached USD 9.10 billion, while quarterly GAAP operating profit was USD 172 million. CyberArk and Chronosphere affect the reported growth and cost base. Q4 operating cash flow of USD 1,357 million less USD 103 million capex equals ordinary FCF of USD 1,254 million; the company’s adjusted FCF was USD 1,289 million. Using the adjusted number against ordinary peer FCF would flatter the comparison.
Palo Alto Networks Q4 FY2026 Results, September 1, 2026
NET’s earnings gap is partly exceptional, but its valuation still needs substantial future conversion. GAAP operating loss of USD 205.7 million includes USD 150.7 million of restructuring and other charges. Adding back that charge alone leaves an approximately USD 55.0 million loss, or negative 7.9% margin; this analytical bridge is not the company’s non-GAAP result. Official non-GAAP operating margin was 13.8%, with additional exclusions including compensation. Even after separating restructuring, profitability remains well below revenue growth.
Cloudflare Q2 2026 Results, August 6, 2026
DDOG combines faster growth with stronger cash conversion than NET in this snapshot. Revenue increased 36%, GAAP operating income was approximately USD 5 million, and FCF was USD 279 million. However, company-level growth is not security-segment growth. Security cross-selling could add distribution efficiency, while observability consumption remains an important driver of results.
Datadog Q2 2026 Results, August 6, 2026
CRWD and FTNT set different external benchmarks. CRWD’s net new ARR grew 51% to USD 332.8 million; GAAP operating loss narrowed, while stock compensation and related payroll taxes totaled USD 399.0 million. That combined charge equals about 27.1% of revenue and should not be labeled pure stock compensation. FTNT’s 33.7% GAAP operating margin demonstrates a different current profitability profile, but appliance economics and quarterly cash timing reduce direct comparability.
CrowdStrike Q2 FY2027 Results, August 26, 2026;
Fortinet Q2 2026 Results, July 29, 2026
For diversified exposure, MSFT’s latest quarter produced USD 40.6 billion operating income on USD 90.0 billion revenue, approximately 45.1%. CSCO reported USD 3.9 billion net income on USD 17.3 billion revenue, with security product revenue up 14%. HPE reported an 11.4% company GAAP operating margin and a 22.0% Networking segment operating margin. These are different profit measures; none is a disclosed standalone security margin. Broad platform profitability cannot be assigned wholesale to the security business.
Microsoft FY2026 Q4 Results, July 29, 2026;
Cisco Q4 FY2026 Results, August 12, 2026;
HPE Q3 FY2026 Results, September 2, 2026Valuation discipline
The table uses U.S. equity data at the September 28, 2026 regular-session close. Market capitalization and trailing revenue come from secondary StockAnalysis snapshots. P/S is recalculated as equity market capitalization divided by TTM revenue; debt, cash, acquisition timing and forward growth are not normalized. No consensus target price or forward EPS is invented.
|
Ticker
|
Equity close / USD
|
Market cap / USD bn
|
TTM sales / USD bn
|
P/S
|
Source
|
|
PANW
|
392.09
|
320.73
|
11.48
|
27.9x
|
|
|
ZS
|
199.39
|
32.51
|
3.35
|
9.7x
|
|
|
OKTA
|
202.18
|
35.35
|
3.07
|
11.5x
|
|
|
NET
|
353.99
|
126.05
|
2.51
|
50.2x
|
|
|
DDOG
|
268.70
|
96.48
|
3.97
|
24.3x
|
|
|
CRWD*
|
259.25
|
266.02
|
5.40
|
49.3x
|
|
Our valuation judgment is cautious on NET and CRWD, demanding on PANW and DDOG, and relatively less stretched on OKTA and ZS. This ranking concerns the sales multiple burden, not total expected return. A simple identity explains the risk: at a hypothetical mature 30% FCF margin, 50x sales corresponds to about 167x that revenue base’s FCF. Revenue growth must do a great deal of work before such an entry valuation becomes moderate.
The mechanism from agent adoption to shareholder value must be explicit. Illustrative analyst assumptions, not guidance: 1,000 enterprise customers paying an incremental USD 100,000 annual security subscription produce USD 100 million ARR. If adoption occurs evenly through the year, recognized first-year incremental revenue is approximately USD 50 million. At an assumed 30% incremental FCF margin, that generates USD 15 million first-year FCF and USD 30 million annualized FCF at full deployment. A hypothetical 30x FCF capitalization would imply USD 450 million on the first-year flow or USD 900 million on the run-rate flow, before discounting, dilution and additional capital needs. Confusing those two cash-flow periods would double the apparent benefit. This is a sensitivity bridge, not a price target.
The reverse test is equally important. If customers replace existing security contracts rather than add budget, the incremental ARR assumption fails. If inference, telemetry storage, sales incentives or remediation costs absorb gross profit, revenue growth may not improve FCF. The strongest investment evidence would be paid adoption with renewal strength and falling cost to serve, followed by growth in FCF per diluted share.
4. Industry and Competitive Landscape
Recent disclosures shift the debate from whether AI replaces security software toward the independent controls AI deployment requires. More capable models expand defense requirements and raise the importance of permission boundaries and accountability for actions.
|
Date
|
Event
|
Verified facts
|
Investment interpretation
|
Source
|
|
Sep 9
|
Anthropic evaluation incidents
|
Misconfigured evaluations reached third-party systems; production safeguards were disabled. Disclosure date is not incident date.
|
Agent isolation, task-scoped identity and runtime controls; OKTA / ZS / PANW; CRWD comparator.
|
|
|
Sep 10
|
Anthropic misuse report
|
Case studies cover December 2025–August 2026; selected unusual cases, not an incidence survey.
|
More automation supports continuous defense demand; no quantified sector revenue uplift.
|
|
|
Sep 14
|
Elastic KREMLIN analysis
|
Browser-extension banking malware and session exposure; campaign name does not establish Russian attribution.
|
Endpoint, browser and session controls; PANW / ZS / OKTA; CRWD comparator.
|
|
|
Sep 22
|
Blueprint Alliance
|
Shared architecture for agent discovery, identity, permissions and runtime governance.
|
OKTA / ZS and ecosystem partners; interoperability can both expand demand and constrain lock-in.
|
|
|
Sep 28
|
Cloudflare cf CLI
|
Agent-oriented, platform-wide CLI enters public beta.
|
Lower adoption friction; watch paid workloads and security attachment.
|
|
|
Sep 28 / 29
|
OpenAI GPT-6.1 Astra
|
AP reports that OpenAI is withholding release over safety concerns.
|
Governance demand strengthens, but AI deployment and usage may be delayed.
|
|
The incidents reveal a boundary problem: a capable agent can act across applications and identities, so a good model alone is not an access-control system. Buyers need to establish who authorized an action, what data may leave, what behavior is observable, and how execution can be interrupted. That creates multiple potential budget owners. It also means no single product category is guaranteed to capture the whole opportunity.
Potential winners differ by control point. OKTA benefits if agent identities require separately monetized lifecycle and access governance. ZS benefits if Zero Trust policies govern more users, workloads and agent traffic. PANW benefits if buyers consolidate enforcement and SOC work onto a broader platform. NET can attach application and edge controls to existing traffic; DDOG can connect security findings to application telemetry. These are business-model inferences, not demonstrated market-share transfers.
The competitive pressure falls on undifferentiated point products and manual workflows. PANW and diversified platforms can bundle capabilities; MSFT, AWS and Google Cloud have existing distribution and platform relationships. Independent vendors must prove better deployment, detection or governance outcomes to defend pricing. It would be premature to name a specific public company as a share loser from the evidence available. Lower growth at OKTA than at NET does not establish that OKTA is losing the same market: their product mix and monetization models differ.
The Blueprint Alliance is particularly relevant because it favors cross-vendor coordination. Open interfaces may reduce integration friction and enlarge the total deployment opportunity, but can also make individual tools easier to replace. Alliance membership is therefore a distribution signal, not a booked-revenue announcement. ACN and IBM may benefit from implementation complexity, whereas automation can pressure labor-based service economics. For diversified stocks, even a successful security launch may be overwhelmed by cloud capex, semiconductor demand, consulting utilization or hardware cycles.
Cloudflare cf: a route from developer tooling to agent-driven cloud adoption
On September 28, Cloudflare introduced the public beta of
cf, an agent-oriented CLI covering more than 3,000 API operations with JSON output by default. The company reported that agents’ share of Wrangler usage rose from roughly 25% in March to 48% in the preceding week. This measures tool usage, not revenue contribution.
Cloudflare cf launch
On September 2, Cloudflare also announced support for Cursor Cloud Agents running on Cloudflare Sandboxes, giving enterprises control over execution location and access to code, systems and secrets.
Cloudflare Sandboxes integration
For NET, the investment implication is that agents could become another route to product adoption. Our inference is that easier deployment could attract more projects to compute, storage and networking services, followed by access controls and application protection as projects enter production. The transmission runs from lower adoption friction to production workloads, usage or subscription revenue, and security cross-selling. Relevant measures are active paid projects, customer expansion, product attachment and profit after compute and support costs; CLI download counts are insufficient.
Broader operational reach also increases the consequences of permission errors. Credential scope, approval for consequential changes and auditability become more valuable as agents can perform more actions. Tool capability does not establish business authorization, and a CLI is not a complete security system. The announcement strengthens NET’s growth narrative, but alone does not justify its approximately 50.2x TTM P/S. Production adoption must translate into revenue and better FCF per share.
OpenAI withholds GPT-6.1 Astra: safety becomes a delivery constraint
AP reported on September 29 that OpenAI had withheld GPT-6.1 Astra’s release over safety concerns on September 28. The decision concerns that version, rather than a halt to the entire GPT family.
Associated Press
In its earlier September 1 disclosure, OpenAI said parts of Astra’s development and release had been delayed while it strengthened protections against cyber misuse and unauthorized actions, including monitoring capable of stopping such behavior. That earlier development stage is distinct from the latest version’s withheld release.
OpenAI: Path to Astra
Our interpretation is that security is becoming a condition for model delivery and enterprise procurement.Relevant needs include identity governance, constrained permissions, isolated execution, runtime monitoring, network egress controls and audit trails. By business capability, OKTA maps to identity governance; ZS and PANW to access and network enforcement; NET to controlled execution and application protection; and DDOG to observability and investigation. This is a demand mapping, not evidence of procurement by OpenAI from those vendors.
The financial effect runs in both directions. Over the medium term, enterprises may raise security budgets to enable deployment at scale. Near term, withheld releases and longer approval cycles may slow agent workload growth and defer cloud consumption and revenue recognition. Usage-sensitive businesses such as NET and DDOG require particular attention to that timing difference. Model vendors’ built-in safeguards also raise the competitive bar for third-party security products. Independent suppliers need to demonstrate cross-model, cross-cloud governance and measurable protection outcomes.
Together, the two developments support a clear investment theme: broader agent capabilities increase the value of reliable authorization and execution controls, while shareholder returns still depend on paid adoption and unit economics.
5. Key Risks
Release timing and security demand can affect revenue in opposite directions. Higher safety thresholds increase governance needs but may defer model launches and enterprise deployment, delaying related cloud consumption. Medium-term security budget growth must be distinguished from near-term workload delays.
Monetization may lag technical deployment. Wider agent adoption does not necessarily expand security budgets. If additional capabilities are included in existing contracts, service costs can rise before subscription revenue.
Platform consolidation can pressure pricing. Bundled identity, endpoint, network and SOC capabilities can increase acquisition costs for independent products. Customer growth that depends on discounts may not improve profitability.
Acquisition integration can weaken growth quality. Acquired ARR does not establish acceleration in the existing business. Product migration, sales integration and employee-retention costs can delay cash returns.
Financial comparisons can overstate quality. Annual subscription collections lift cash flow before revenue recognition; capex timing can depress a single quarter. Acquisitions alter organic growth and purchase-accounting costs. Non-GAAP adjustments and stock compensation require per-share scrutiny. NET’s restructuring bridge is informative but does not prove all excluded costs are nonrecurring.
Valuation and demand are separate risks. Strong results can accompany negative equity returns if expected growth or the acceptable multiple falls. Bundling can suppress standalone pricing, AI can automate existing service work, and enterprises can reallocate rather than expand security budgets. A security vendor’s own operational failure may create remediation costs and damage retention. The report therefore treats product launches and incident headlines as hypotheses to validate against contracts and cash.
6. Monitoring Checklist
Use the following checklist at each earnings release and material business update. The baseline is selective demand optimism with valuation restraint. Upgrade conviction only when paid adoption, organic growth and cash conversion reinforce one another. Downgrade it if security spending merely migrates between products or accounting adjustments do more work than operating improvement.
|
Object
|
Track
|
Confirmation
|
Invalidation
|
|
OKTA
|
cRPO, paid agent adoption, GAAP margin
|
cRPO converts to revenue while margin holds
|
Agent features mainly included free; growth slows
|
|
ZS
|
Organic ARR, capex, annual FCF conversion
|
Capacity deployment supports demand and cash recovery
|
Spending remains elevated without organic acceleration
|
|
PANW
|
Organic growth bridge, acquisition integration, ordinary FCF
|
Cross-sell and retention improve without excessive incentives
|
Acquired ARR masks weaker underlying demand
|
|
NET / DDOG
|
Security monetization, GAAP bridge, FCF per share
|
Paid security attach and operating leverage emerge
|
Growth remains expensive to serve or dilution absorbs cash
|
|
Diversified suppliers
|
Security revenue or bookings versus group drivers
|
Disclosed security contribution becomes material
|
AI/cloud/hardware cycle dominates security thesis
|
|
Agent monetization
|
Production workloads, paid conversion, release and deployment timing
|
Paid adoption and security attachment improve together
|
Longer approvals, deferred usage or service costs weaken profit
|
7. Sources
Financial data are sourced from company results and SEC filings; valuation uses September 28, 2026 closing snapshots. Fiscal calendars, business models and acquisition effects differ, as discussed in the financial comparisons.