Author: LBank Research Analyst: Steven.fu
Disclaimer: This report is compiled and analyzed from publicly available information and is intended solely for informational and research purposes. It does not constitute investment advice, a securities recommendation, a trading instruction, or any guarantee of returns. The company's operations, valuation, market price, and consensus expectations discussed herein may change over time. Readers should independently verify the data and make their own decisions.
1. Core Conclusion: An Earnings Surge and Valuation Overreach Are Happening at the Same Time
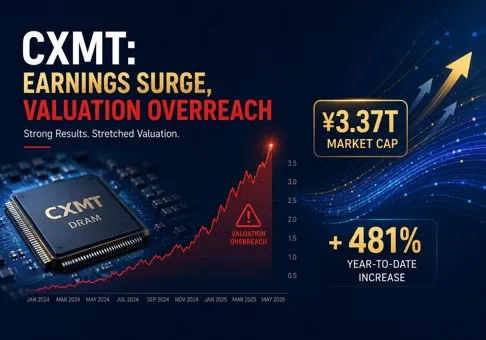
Overall view: CXMT is China's scarcest and most strategically valuable DRAM IDM. Its products, capacity, and customer qualifications demonstrate strong corporate quality. However, at the ¥50.35 share price on August 10, 2026, its market capitalization is approximately ¥3.37 trillion. The stock has already priced in a substantial portion of this DRAM upcycle and the domestic-substitution opportunity, leaving the current risk-reward skewed to the downside. The most important variable is whether elevated DRAM pricing can persist after the international top three expand capacity and HBM-driven capacity allocation begins to normalize.
-
CXMT is the clear domestic DRAM winner, but it has not yet won a place in the industry's highest-end profit pool. The company operates three 12-inch DRAM wafer fabs in Hefei and Beijing. Its global revenue share reached 7.67% in 4Q25, ranking first in China and fourth worldwide. DDR5 and LPDDR5/5X are in mass production, while server revenue increased from ¥0.395 billion in 2023 to ¥15.970 billion in 2025. Localization, leapfrog product development, and capacity ramp-up have created genuine competitiveness. However, the prospectus discloses no HBM product line, and AI-compute server revenue remains relatively low. CXMT currently benefits more from AI products crowding out conventional DRAM supply than from directly participating in HBM's highest-margin profit pool.
-
The 2026 earnings surge is being driven jointly by price increases, volume growth, and mix upgrades, with cyclical pricing making the largest contribution. In 2025, DDR average selling prices rose 61.00%, unit volume increased 282.22%, and revenue grew 515.36%; LPDDR average selling prices rose 24.46%, unit volume increased 65.18%, and revenue grew 105.59%. This transmission chain continued as follows: higher-generation products and tight supply led 2025 consolidated gross margin to rise from 5.58% to 40.99%; 1Q26 revenue then increased 719.13% year over year to ¥50.800 billion; and attributable net profit swung from a ¥1.559 billion loss to a ¥24.762 billion profit. Management estimates 1H26 revenue of ¥110-120 billion and attributable net profit of ¥50-57 billion. The earnings trajectory is exceptionally steep, but the prospectus also explicitly warns that continued sharp price increases from already elevated levels are unsustainable.
-
Earnings have turned positive, but cash returns have not yet overcome the capital intensity of the business. Operating cash flow was ¥36.520 billion in 2025, up sharply from ¥6.897 billion in 2024. Purchases of long-term assets totaled ¥49.739 billion over the same period, leaving simplified free cash flow, defined as operating cash flow less long-term asset purchases, at negative ¥13.219 billion. At year-end 2025, cash and cash equivalents were ¥51.990 billion, while short-term borrowings, current maturities of long-term borrowings, and long-term borrowings totaled approximately ¥143.900 billion. Net IPO proceeds of ¥57.638 billion substantially improved liquidity, but did not change the fundamental economics of DRAM: sustained R&D and capacity investment, together with heavy depreciation.
-
The valuation treats peak-cycle earnings as though they were relatively stable. ¥50.35 is 481.4% above the ¥8.66 IPO price and implies a market capitalization of approximately ¥3.37 trillion. Even mechanically annualizing the ¥50-57 billion of estimated first-half attributable net profit produces a P/E of roughly 29.5-33.7x; mechanically annualizing first-half revenue implies a P/S of approximately 14.0-15.3x. The sharper comparison is that SK Hynix's market capitalization was approximately ¥5.94 trillion as of July 13, 2026, according to the listing announcement. CXMT is already worth 56.7% as much, even though its 7.67% share is only about 22% of SK Hynix's 34.48% share. The current price embeds not only domestic substitution, but also a prolonged period of unusually high net margins and continued narrowing of the technology gap.
-
The negative view has clear conditions for reversal. The current valuation could be absorbed through earnings delivery if 2026 full-year attributable net profit reaches at least ¥120 billion, gross margin before inventory write-down reversals remains above 40% after DRAM pricing normalizes, global share exceeds 10%, and CXMT formally discloses that HBM or another next-generation high-bandwidth product has entered volume production for a leading customer. Conversely, if gross margin falls below 30%, server revenue mix stops rising, free cash flow remains negative, or the valuation still exceeds 30x annualized peak earnings around the early-2027 lock-up expirations, the ¥3.37 trillion market capitalization would look more like a scarcity premium amplified by the limited free float than sustainable value.
2. Company Overview, Business Mix, and Core Operating Metrics: Mobile Memory Provides the Base While Server DDR5 Reshapes the Profit Pool
Founded in 2016, CXMT is an integrated memory manufacturer spanning DRAM design, wafer fabrication, selected testing, module design, and applications. The company performs front-end wafer fabrication in-house, primarily outsources chip packaging, handles most finished-product testing internally with outsourced support, and combines internal and outsourced module assembly. Its principal products are standardized DRAM chips, supplemented by limited wafer and memory-module sales. Customers purchase memory based on capacity, data rate, power consumption, reliability, and supply stability; revenue therefore varies primarily with shipped bit volume, product generation, market pricing, and customer mix.
CXMT uses a combination of distribution and direct sales. Distributors, most of which purchase products outright and help the company reach module makers and end customers, generated 85.38% of principal-business revenue in 2025. Direct sales contributed 14.62%, with customers including server, smartphone, and PC manufacturers such as Alibaba Cloud, ByteDance, Tencent, Lenovo, Xiaomi, Transsion, Honor, OPPO, and vivo. The five largest customers contributed 68.08% of revenue, and no single customer exceeded 50%; nevertheless, channel and customer concentration remain high.
|
2025 Business
|
Products, Customers, and Revenue Model
|
Revenue
|
Share of Principal-Business Revenue
|
Gross Margin Before Inventory Write-Down Reversals / Key KPI
|
Research View
|
|
DDR Series
|
DDR5 chips and RDIMM, MRDIMM, UDIMM, and other modules for servers, PCs, and workstations; revenue is based on chip, wafer, and module volumes and market prices
|
¥19.531bn
|
31.87%
|
41.89%; volume +282.22%, ASP +61.00%
|
DDR5 volume has made servers the fastest-growing profit pool
|
|
LPDDR Series
|
LPDDR4X and LPDDR5/5X for smartphones, tablets, thin-and-light notebooks, wearables, and intelligent vehicles
|
¥40.704bn
|
66.43%
|
37.25%; volume +65.18%, ASP +24.46%
|
Remains the revenue base, with mature customers but less cyclical upside than DDR5
|
|
Other Products and Services
|
Limited DRAM wafers, technology R&D services, wafer foundry services, and related photomasks
|
¥1.041bn
|
1.70%
|
-17.23%
|
Small and loss-making before inventory write-down reversals; not central to the valuation
|
|
Total Principal Business
|
DRAM chips, wafers, modules, and related services
|
¥61.275bn
|
100%
|
37.80% gross margin before inventory write-down reversals
|
Higher volume and pricing, together with product upgrades, produced an earnings inflection
|
Note: Principal-business revenue is lower than total revenue of ¥61.799 billion, with the difference attributable to other-business revenue. Gross margins exclude reversals of inventory write-down provisions and therefore better reflect current-period product economics. Year-over-year changes are recalculated from prospectus amounts or disclosed rates; rounding may cause minor differences.
LPDDR is currently CXMT's largest-scale asset. LPDDR4X has entered the supply chains of Xiaomi, OPPO, vivo, Transsion, Lenovo, and others, while LPDDR5/5X has entered brands including Xiaomi and Transsion. Mobile devices generated 60.40% of principal DRAM product revenue in 2025. This business gives CXMT stable shipments, customer validation, and capacity utilization, but also leaves revenue highly exposed to smartphone demand and commodity DRAM pricing.
DDR5 is changing the profit mix. CXMT began mass-producing DDR5 at the end of 2024. DDR's revenue share rose from 13.26% to 31.87% in 2025, while the server-application revenue share increased from 8.39% to 26.51%. Server revenue posted a two-year CAGR of 536.24%. DDR5 gross margin before inventory write-down reversals was 41.89% in 2025, above LPDDR's 37.25%, showing that server pricing, density, and mix are contributing more incremental profit. The key caveat is that CXMT says revenue from AI-compute servers remains relatively low; investors should not equate all server revenue with AI or HBM revenue.
Core Operating Metrics and Changes
The catalyst for this report is CXMT's July 27, 2026 listing on the STAR Market. The listing announcement confirms an IPO price of ¥8.66, 66.881 billion shares outstanding after the offering, and an initial unrestricted float of 4.503 billion shares. At 11:06 on August 10, the share price was ¥50.35, up 481.4% from the IPO price but only 2.8% above the ¥49.00 closing price on the first trading day. This divergence shows that the principal re-rating occurred between the IPO pricing and the first-day close; marginal price discovery after listing has been largely flat.
|
Metric / Event
|
Latest Value or Development
|
YoY / Historical Comparison
|
Accounting or Statistical Basis
|
Implications for Revenue, Earnings, Cash Flow, and Valuation
|
|
Estimated 1H26 Revenue
|
¥110-120bn
|
+612.53% to +677.31% YoY
|
Management estimate; neither audited nor reviewed
|
The low end is already about 78% above full-year 2025, as pricing and volume enter a steep growth phase simultaneously
|
|
1Q26 / 1H26 Attributable Net Profit
|
¥24.762bn / ¥50-57bn
|
1Q swung from a ¥1.559bn loss; 1H from a ¥2.332bn loss
|
1Q reviewed; 1H management estimate
|
Midpoint net margin of roughly 46.5% clearly bears the hallmarks of a cyclical peak
|
|
Products and Capacity
|
7.67% global share in 4Q25; 95.73% capacity utilization; 90.67% production-to-sales ratio
|
Capacity utilization has risen steadily from 87.06% in 2023
|
Omdia revenue share and company capacity statistics
|
Capacity is nearly full, so incremental supply requires expansion; the lower production-to-sales ratio makes inventory and mix management increasingly important
|
|
Operating Cash Flow / Simplified FCF
|
¥36.520bn / -¥13.219bn in 2025; ¥42.566bn 1Q26 OCF
|
2025 OCF increased ¥29.622bn versus 2024; 1Q rose sharply YoY
|
Simplified FCF = OCF less purchases of long-term assets
|
Rising prices are releasing cash rapidly, but full-year capital expenditures may still consume operating cash flow
|
|
IPO and Balance Sheet
|
¥57.638bn net proceeds; ¥29.5bn planned use
|
Actual net proceeds substantially exceeded the original ¥29.5bn plan
|
Before exercise of the over-allotment option
|
A much larger cash buffer strengthens R&D and expansion capacity, but also raises required returns on capital
|
|
Market Price and Free Float
|
¥50.35; ¥3.37trn market capitalization; initial float only 6.73% of shares
|
+481.4% from the IPO price; +2.8% from first-day close
|
August 10, 2026, 11:06 market snapshot
|
The limited float amplifies the scarcity premium; short-term price should not be equated directly with long-term value
|
Note: The estimated 1H26 results do not constitute an earnings forecast or performance commitment. Market capitalization was independently checked against the public market snapshot; offering data are presented before exercise of the over-allotment option.
Based on 1Q results and first-half guidance, 2Q revenue is implied at approximately ¥59.2-69.2 billion, up roughly 16.5% to 36.2% sequentially, while 2Q attributable net profit is implied at approximately ¥25.2-32.2 billion, up roughly 1.9% to 30.2%. This indicates that the industry upturn continued at least through the second quarter. However, the low end of earnings growth is already materially slower than the high end of revenue growth, making it increasingly important to distinguish the contributions from pricing, product mix, and incremental depreciation.
The listing itself did not improve CXMT's technology roadmap, but it resolved a financing bottleneck. The original offering projects included ¥7.5 billion for production-line upgrades, ¥13.0 billion for DRAM technology upgrades, and ¥9.0 billion for forward-looking R&D. Actual net proceeds of ¥57.638 billion were approximately 1.95 times planned uses. The additional funds can accelerate process upgrades and capacity expansion, but may also create greater depreciation, inventory, and capital-efficiency pressure when the supply cycle reverses.
3. Fundamental Quality: Accounting Earnings Have Surged, but Cash Returns Still Fall Short of Heavy Capital Requirements
|
Item
|
2024A
|
2025A
|
1Q26 / 1H26E
|
Research View
|
|
Revenue
|
¥24.178bn
|
¥61.799bn
|
¥50.800bn / ¥110-120bn
|
Capacity, volume, ASP, and product generation all contribute; current growth cannot be extrapolated linearly
|
|
Consolidated Gross Margin
|
5.58%
|
40.99%
|
Not disclosed
|
Pricing recovery and lower unit costs are happening simultaneously, creating extreme cyclical sensitivity
|
|
Attributable Net Profit
|
-¥7.145bn
|
¥1.875bn
|
¥24.762bn / ¥50-57bn
|
CXMT first became profitable only in 2025; 1H26 has already entered a peak-earnings range
|
|
Operating Cash Flow
|
¥6.897bn
|
¥36.520bn
|
¥42.566bn / not disclosed
|
Cash flow is improving faster than earnings, with significant contributions from depreciation and working capital
|
|
Simplified Free Cash Flow
|
-¥64.332bn
|
-¥13.219bn
|
Not disclosed
|
Persistently negative; CXMT has not shown that it can self-fund expansion
|
|
Purchases of Long-Term Assets
|
¥71.230bn
|
¥49.739bn
|
Not disclosed
|
Heavy capital investment has consistently exceeded operating cash flow, with scale economies accompanied by depreciation pressure
|
|
Cash / Borrowings
|
¥42.699bn / ¥128.738bn
|
¥51.990bn / ¥143.900bn
|
1Q assets of ¥388.166bn; ¥57.638bn net IPO proceeds
|
The IPO materially reduced financing risk, but capital returns still depend on the cycle and capacity efficiency
|
Note: Borrowings comprise short-term borrowings, current maturities of long-term borrowings, and long-term borrowings. Simplified FCF equals net cash from operating activities less cash paid to acquire fixed assets, intangible assets, and other long-term assets. 1H26E is a management estimate that has not been audited or reviewed.
Growth and margins. Principal DRAM product unit volume posted an 83.98% CAGR from 2023 to 2025, while capacity utilization increased from 87.06% to 95.73%, showing that revenue growth was supported by physical output. At the same time, DDR and LPDDR unit costs fell 26.26% and 22.85%, respectively, in 2025 as scale economies and lean manufacturing began to take effect. The earnings surge was still led by selling prices: ASPs for the two product families rose 61.00% and 24.46%, respectively, and the prospectus cites the supply shortage since the second half of 2025 as an important driver of earnings growth. If selling prices fall faster than unit costs, gross margin of roughly 40% could unwind quickly.
Cash flow and capital expenditures. Fixed-asset depreciation was ¥24.680 billion in 2025, approximately 13.2 times attributable net profit, and was a major reason operating cash flow materially exceeded accounting earnings. Inventory growth simultaneously consumed ¥10.863 billion of cash. At year-end 2025, fixed assets had a carrying value of ¥183.024 billion and represented 54.34% of total assets. Any technology upgrade, roadmap change, or price decline could amplify earnings volatility through depreciation and impairments. Positive operating cash flow is a meaningful improvement; negative free cash flow shows that CXMT has not yet navigated a full capacity-expansion cycle.
Balance sheet and capital allocation. Attributable equity was only ¥56.754 billion at year-end 2025, versus total shareholders' equity of ¥154.100 billion, indicating a high non-controlling-interest share. Valuation and per-share earnings should therefore prioritize amounts attributable to the parent. Accumulated uncovered losses were negative ¥36.650 billion at year-end 2025, leaving little near-term basis for cash dividends. Net IPO proceeds cover more than four times the 2025 simplified FCF deficit, materially reducing liquidity risk. If the funds continue to finance capacity expansion while product pricing weakens, incremental depreciation and low-return assets will convert today's financing advantage into future earnings pressure.
Fundamental conclusion. CXMT's operating quality can be characterized as strong technology and market share, highly cyclical earnings, and still-weak cash returns. The single most important variable is whether gross margin excluding inventory write-down reversals can remain above 35% after industry pricing normalizes. This measure is more informative than unadjusted net profit for assessing whether technology, yield, scale, and product mix have created a sustainable cost advantage.
4. Industry and Competitive Landscape: CXMT Wins in Domestic Substitution, While SK Hynix Captures AI's Richest Profit Pool
DRAM is a highly standardized, capital-intensive, and cyclical memory semiconductor. Servers, smartphones, PCs, and intelligent vehicles determine demand, while wafer capacity, process generation, yield, and product mix determine supply costs. Samsung Electronics, SK Hynix, and Micron Technology together control more than 90% of global revenue. Their allocation of capacity between HBM and advanced DRAM also feeds back into conventional DDR and LPDDR supply. Industry share therefore reflects genuine technology and customer qualifications, but can also be magnified by short-term pricing and product mix.
|
Competitive Dimension
|
CXMT's Verifiable Position
|
Share / Scale Basis and Limitations
|
Principal Competitors or Alternatives
|
Implications for Growth, Margins, and Valuation
|
|
Demand and Customers
|
Mobile devices represent 60.40% and servers 26.51%; qualified by several Chinese cloud, smartphone, and PC manufacturers
|
Application revenue is not the same as end-brand procurement share; AI-server mix is not disclosed separately
|
Samsung, SK Hynix, Micron, and Nanya; end customers can also use multiple suppliers
|
Domestic supply-chain security creates incremental demand, but standardized products remain exposed to global price competition
|
|
Technology and Products
|
DDR5 and LPDDR5/5X in mass production, with mainstream density and speed coverage approaching international peers
|
The prospectus says core products have reached internationally advanced levels, but discloses neither process node, yield, nor HBM revenue
|
The international top three have deeper process, patent, and HBM capabilities
|
The mainstream DRAM gap is narrowing, but a clear gap remains in the premium AI profit pool
|
|
Capacity and Cost
|
Three 12-inch fabs; 95.73% utilization in 2025; fourth largest globally
|
Absolute monthly capacity and per-wafer yield are not disclosed, preventing precise peer comparison
|
The international top three are also raising capex; Nanya is smaller
|
Further expansion can reduce costs, but increases depreciation risk when the supply cycle reverses
|
|
Channels and Ecosystem
|
Distribution represents 85.38%, top five customers 68.08%; strong coordination with China's equipment and materials ecosystem
|
A high share of Hong Kong transactions and distribution sales provides less end-demand visibility than direct sales
|
International suppliers have more mature global direct sales, module, and long-term customer relationships
|
Localization is a moat, while concentration and channel inventory amplify the cycle
|
|
Capital and Valuation
|
Current market capitalization of approximately ¥3.37trn; ¥57.638bn net IPO proceeds
|
CXMT's price is based on the August 10 snapshot; peer market capitalizations use the July 13 listing-announcement date
|
Samsung, SK Hynix, and Micron have larger revenue, capacity, and capital-market track records
|
Financing capacity has improved, but the market capitalization already prices in long-term catch-up success
|
|
Company
|
Global DRAM Share Basis
|
2025 Revenue / Net Profit
|
2025 Consolidated Gross Margin
|
Product and Operating Status
|
Competitive Conclusion
|
|
CXMT
|
7.67% of 4Q25 revenue
|
¥61.799bn / ¥7.144bn total net profit
|
40.99% (37.81% before inventory write-down reversals)
|
DDR5 and LPDDR5/5X in mass production; 95.73% utilization; server revenue scaling rapidly; no disclosed HBM mass production
|
Clear winner from domestic substitution and share gains, but still behind in the premium AI profit pool
|
|
SK Hynix
|
34.48% of 2025 revenue
|
KRW97.15trn / KRW42.95trn
|
60.41%
|
Leading scale in DRAM, NAND, and HBM, with margins materially above peers
|
The clearest current winner in AI memory
|
|
Samsung Electronics
|
33.96% of 2025 revenue
|
KRW333.61trn / KRW45.21trn
|
39.38%
|
Broadest product line, global capacity, and customer reach; revenue also includes non-memory businesses
|
Still the scale leader, with share slightly below SK Hynix
|
|
Micron Technology
|
23.41% of 2025 revenue
|
US$37.378bn / US$8.539bn
|
39.79%
|
Exposure across DRAM, NAND, and HBM, supported by U.S. capital and customer resources
|
Beneficiary of premium products, though smaller than the two Korean leaders
|
|
Nanya Technology
|
Not separately disclosed in the prospectus
|
NT$66.587bn / NT$6.613bn
|
22.51%
|
Capable of mass-producing mainstream DDR, but some high-density DDR5 and LPDDR5 products remain under development
|
Relatively behind in products and scale; a loser in the current share competition
|
Note: The top three companies' shares are based on full-year 2025 revenue, while CXMT's is based on 4Q25 revenue, so they cannot be added directly. Company revenue covers different business scopes and uses different currencies, fiscal years, and accounting standards; the figures are intended only to compare scale, margins, and operating direction.
SK Hynix is the strongest current winner. Its 2025 gross margin of 60.41% was materially above CXMT's 37.81% before inventory write-down reversals, Samsung's 39.38%, and Micron's 39.79%. This demonstrates how HBM and premium server memory concentrate the industry's richest profit pool among suppliers with leading products and customer qualifications. CXMT has benefited from both tight supply and localization through its server DDR5 products, but there is no evidence that it has entered a profit pool comparable to HBM. Valuing conventional server DDR5 growth as though it were HBM would overstate business quality.
CXMT is nevertheless a clear net beneficiary in mainstream DRAM and China's domestic supply chain. Its leapfrog development strategy covers DDR5 and LPDDR5/5X, and its global share reached 7.67% in 4Q25, far above the IDM scale available from other mainland Chinese DRAM design companies. Nanya is relatively behind in high-density DDR5 and LPDDR5 products and is the current loser in the competitive landscape. The international top three will not be displaced quickly: together they hold more than 90% share, spend more on capex, and have deeper customer relationships. Once HBM expansion is complete and legacy capacity is reallocated to conventional DRAM, CXMT's pricing and margins could come under pressure faster than its share.
The valuation gap has narrowed more aggressively than the operating gap. On the July 13 basis in the listing announcement, SK Hynix's market capitalization was approximately ¥5.94 trillion; CXMT was worth approximately ¥3.37 trillion on August 10, or 56.7% as much. CXMT's share is only about 22% of SK Hynix's, while its gross margin is roughly 22.6 percentage points lower. Domestic scarcity can explain a premium, but cannot by itself explain such dramatic convergence in market value. Closing the remaining gap will require higher share, HBM products, and cash flow that can withstand the cycle.
5. Principal Risks
-
A reversal in DRAM pricing and the supply-demand cycle. DDR and LPDDR ASPs rose 61.00% and 24.46%, respectively, in 2025, while 1H26 earnings assume continued rapid price increases. If the international top three expand capacity, conventional DRAM supply recovers after HBM capacity comes online, or cloud-provider capex slows, falling prices will first compress gross margin and then magnify the impact on net profit and valuation through inventory write-downs, capacity utilization, and fixed costs.
-
The gap in HBM and premium AI products. CXMT's disclosed core products are DDR, LPDDR, and modules, while AI-compute server revenue remains relatively low. If HBM continues to capture the incremental profit in server memory and CXMT cannot achieve volume production for leading accelerator and cloud customers, the company may win standard DRAM share while missing the highest-margin profit pool, requiring a reduction in the current AI premium.
-
International trade restrictions and supply-chain instability. The U.S. Department of Defense added subsidiary ChangXin Memory Technologies to a relevant list on June 8, 2026; the company says this does not have a material adverse impact on daily operations. If future restrictions expand to advanced equipment, EDA software, materials, components, or customer cooperation, process iteration and capacity expansion could slow, simultaneously impairing unit costs, yields, and delivery capability.
-
Heavy capital requirements, depreciation, and asset impairment. Fixed assets were ¥183.024 billion, depreciation ¥24.680 billion, and purchases of long-term assets ¥49.739 billion in 2025. If new lines ramp more slowly than expected, the technology roadmap changes, or product prices fall below cost, substantial depreciation, inventory write-downs, and fixed-asset impairments could again cause operating cash flow and accounting earnings to diverge.
-
Customer, distributor, and inventory concentration. The top five customers generated 68.08% of principal-business revenue, distribution represented 85.38% of sales, and year-end 2025 inventory was ¥29.390 billion. If major distributors destock, end customers change suppliers, or payment terms and channel financing shift, shipment data may lag underlying demand while revenue, cash collections, and inventory valuation come under pressure simultaneously.
-
Limited free float, lock-up expirations, and valuation volatility. Unrestricted shares represented only 6.73% of total shares at listing, amplifying price sensitivity through limited supply. Approximately 1.521 billion offline-placement shares become eligible for release six months after listing, equal to 33.8% of the initial float; strategic-placement and pre-IPO shares have 12-36 month lock-ups. If earnings expectations fall before tradable supply increases, the current ¥3.37 trillion market capitalization may be digested through a lower share price rather than earnings growth.
6. Monitoring Checklist
-
Formal 1H26 report: Revenue should be at least ¥110 billion and attributable net profit at least ¥50 billion. Results below management's estimated range would directly weaken the credibility of the current peak-earnings denominator.
-
Gross margin before inventory write-down reversals: Remaining above 35% after pricing normalizes would demonstrate a cost advantage derived from yield, scale, and product mix; falling below 30% would reinforce the view that the cycle has been overcapitalized.
-
DDR5 and server revenue mix: An increase in the server-application revenue share from 26.51% to more than 35%, provided it is not driven solely by pricing, would strengthen the product-upgrade thesis. Stagnation or decline would indicate that premium-product penetration is stalling.
-
HBM or another next-generation high-bandwidth product: Only formal disclosure of sampling, qualification, and volume-production revenue from leading customers should count as entry into AI's richest profit pool. R&D disclosure or server DDR5 growth alone is insufficient to change the valuation view.
-
Capacity, production-to-sales ratio, and inventory: Capacity utilization above 90%, a production-to-sales ratio recovering above 95%, and no material increase in inventory write-downs would show that demand can absorb expansion. Utilization below 85% would be a warning of oversupply.
-
Operating cash flow and capital expenditures: Positive full-year simplified FCF would be the first evidence that CXMT can partially self-fund expansion. If FCF remains negative after the IPO, the assessment of capital returns should be reduced.
-
Global share and competitor capex: Share above 10% would strengthen CXMT's position as the global No. 4. Investors should simultaneously track Samsung, SK Hynix, and Micron's allocation of capacity between conventional DRAM and HBM; synchronized expansion by all three would weaken the pricing outlook.
-
Lock-up expirations and free float: Focus on approximately 1.521 billion offline-placement shares around January 27, 2027, followed by strategic-placement expirations. If the valuation still depends on more than 30x annualized peak earnings as tradable supply increases, share-price volatility risk will rise.
7. Sources