Author: LBank Research Analyst: Ludo
Disclaimer: This report is compiled and analyzed from publicly available information and is intended solely for information sharing and research discussion. It does not constitute investment advice, a securities recommendation, a trading instruction, or any guarantee of returns. The company operations, valuations, market prices, and consensus expectations discussed herein may change over time. Readers should independently verify the data and make their own decisions.
1. Core Conclusion
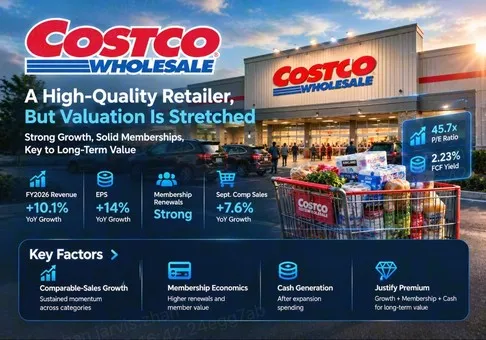
Overall judgment: Costco Wholesale Corporation is a high-quality retailer with strong customer economics, but its equity valuation is stretched and the risk-reward is mildly negative at the reference close. The decisive variable is sustained underlying comparable-sales growth after fuel, currency and calendar assistance fade.
-
The operating franchise remains a winner. September adjusted comparable sales of 7.6% support continued member spending. The investment implication is greater confidence in earnings durability, rather than an automatic entitlement to a higher earnings multiple.
-
Membership economics provide resilience. Annual fee revenue reached USD 5.907 billion, while U.S./Canada renewal was 92.3%. This recurring relationship reduces demand uncertainty, but fee revenue is not a separately reported profit segment and should never be equated mechanically with net income.
-
Cash conversion is strong. Final FY2026 FCF was USD 9.382 billion. It gives management room to expand and distribute capital, although working-capital support means the entire increase should not be capitalized as a permanent improvement.
-
The equity already rewards consistency generously. The October 8 reference close of USD 947.92 divided by annual diluted EPS implies 45.7x earnings. Using 443.266 million year-end shares implies equity value of USD 420.18 billion and an approximately 2.23% annual FCF yield. These are calculated reference measures, with a dated share count rather than a real-time capitalization.
-
A modest derating can consume another year of earnings growth. An illustrative 12% EPS increase with a 40x multiple produces USD 930.05 per share, approximately 1.9% below the reference close before dividends. The quality thesis is stronger than the near-term valuation thesis.
Valuation and the expectation gap
Our base scenario assumes continued warehouse productivity, healthy membership retention and modest operating leverage. It is a research sensitivity, not management guidance or analyst consensus. Applying 12% growth to annual EPS and a 40x multiple gives the value above. A cautious scenario of 8% EPS growth and 35x gives USD 784.73, or approximately 17.2% downside. A favorable scenario of 16% EPS growth and 46x gives USD 1,107.75, or approximately 16.9% upside. These scenarios use reported annual EPS without fully removing tariff refunds; conservative normalization would modestly reduce the starting earnings base.
The useful question is whether earnings can compound fast enough to absorb multiple normalization. At an unchanged share price, a future 40x multiple requires EPS of USD 23.70, about 14.2% above the latest annual figure. This does not make that outcome impossible. It shows that another strong year can be necessary simply to preserve the price. A widening premium adds upside but also increases dependence on investor sentiment and discount rates. No peer-median multiple, consensus estimate, formal rating or personalized trade instruction is asserted here.
2. Company Overview, Business Mix, and Core Operating Metrics
Costco earns money by selling merchandise and services to paying members. Its value proposition links low markups, a selected assortment, large purchase volumes and frequent shopping. Annual access fees complement merchandise economics. Executive upgrades add fee income while rewards encourage engagement; the reward obligation is an economic cost, so higher-tier membership does not translate into pure incremental profit.
The business should be analyzed through both merchandise mix and geography. A food basket supports routine visits; discretionary goods create opportunities for larger tickets but introduce cyclicality. Fuel and ancillary services encourage repeat traffic. Digital ordering, business centers and travel extend the customer relationship, yet their fulfillment economics differ. This is a physical purchasing and distribution franchise with a digital channel, not a software subscription business.
Table 1. Business structure
|
Business / revenue stream
|
FY2026 revenue, USD billion
|
Economic role and constraint
|
|
Foods and Sundries
|
116.788
|
Recurring basket; purchasing scale and price credibility
|
|
Non-Foods
|
77.375
|
Discretionary basket; greater demand and tariff sensitivity
|
|
Fresh Foods
|
41.715
|
Visit frequency; spoilage and labor execution
|
|
Warehouse Ancillary and Other Businesses
|
61.369
|
Fuel, services, e-commerce and travel; fuel changes the sales mix
|
|
Membership fees
|
5.907
|
Annual access fees; renewal and Executive upgrades
|
The merchandise rows sum to net sales; membership fees bring the total to consolidated revenue. Digitally-enabled activity overlaps the categories above and must not be added as a separate revenue segment. Reportable segments are geographic, and category profit is not disclosed. U.S., Canada and Other International FY2026 operating income was USD 7.647 billion, USD 2.107 billion and USD 1.931 billion, respectively. The U.S. is the largest profit engine; international growth can diversify earnings but adds currency and site-execution exposure.
Core operating metrics and changes
Table 2. Operating dashboard
|
Metric / event
|
Latest verified reading
|
Interpretation
|
|
September net sales
|
USD 30.02 billion; +13.0%
|
Five-week retail month; not a calendar month
|
|
September adjusted comparable sales
|
7.6%
|
Excludes gasoline-price and foreign-exchange effects
|
|
September digitally-enabled sales
|
+19.0%; +19.1% ex-FX
|
Sales initiated digitally; broader than delivery
|
|
Labor Day timing
|
A little over +50 bps
|
Headline acceleration includes calendar assistance
|
|
Q4 adjusted comparable sales
|
6.7%
|
September improves on the recent quarterly baseline
|
|
Paid members / Executive members
|
84.1 million / 42.3 million
|
Year-end counts; not annual average active subscribers
|
|
Renewal, U.S./Canada / worldwide
|
92.3% / 89.8%
|
Lagged renewal calculation
|
|
FY2026 diluted EPS / Q4 refund benefit
|
USD 20.76 / USD 0.15
|
Refund benefit should not be extrapolated
|
|
New information
|
October 7 sales update and 10-K
|
Fresh trigger inside the ten-day selection window
|
September is a promising opening signal for the next fiscal year. It improves the underlying sales baseline while digital participation broadens. However, a retail month is a discrete observation with a particular holiday calendar. The reported growth rate does not identify how much came from traffic, ticket, new sites or category shifts, and we do not manufacture those components. The correct inference is that demand remains healthy, with further monthly releases needed to establish persistence.
Membership counts are stocks at year-end, whereas fees are flows recognized over the year. Dividing fee revenue by the ending member count produces a blended accounting ratio, not the actual annual price paid by an average member. Renewal is also backward-looking. These distinctions matter because an impressive loyalty statistic can coexist with slower new-member acquisition or weaker renewals in newer digital cohorts.
3. Fundamental Quality
Table 3. Historical and latest financial comparison
|
Metric
|
FY2025
|
FY2026
|
Reading
|
|
Total revenue, USD billion
|
275.235
|
303.154
|
Growth 10.1%
|
|
Operating income, USD billion
|
10.383
|
11.685
|
Growth 12.5%
|
|
Operating margin on total revenue
|
3.77%
|
3.85%
|
Modest leverage
|
|
Net income, USD billion
|
8.099
|
9.226
|
Growth 13.9%
|
|
Diluted EPS, USD
|
18.21
|
20.76
|
Growth 14.0%
|
|
Operating cash flow, USD billion
|
13.335
|
15.817
|
Final 10-K figures
|
|
Capital expenditure, USD billion
|
5.498
|
6.435
|
Growth 17.0%
|
|
FCF, USD billion
|
7.837
|
9.382
|
OCF less capital expenditure
|
|
Cash and short-term investments, USD billion
|
15.284
|
21.301
|
Liquidity strengthens
|
|
Current and long-term debt, USD billion
|
5.788
|
6.162
|
Excludes leases
|
|
Inventories, USD billion
|
18.116
|
19.324
|
Growth 6.7%
|
|
Accounts payable, USD billion
|
19.783
|
22.591
|
Supplier financing supports cash conversion
|
All annual figures cover 52 weeks. FCF is our calculation, not a separate GAAP statement item. The October 7 10-K reports OCF of USD 15.817 billion, compared with USD 15.825 billion in the preliminary September 24 release. The final filing takes precedence; the USD 8 million difference does not change the conclusion.
Growth quality is strong, with moderate operating leverage. Merchandise demand and fee income support profitability through different mechanisms. The relatively thin consolidated operating margin is a deliberate consequence of the member-value model. It is not evidence of a weak moat by itself. Equally, a thin margin makes wage, logistics and pricing decisions economically significant. A small change in the expense ratio can alter earnings substantially because it applies to a very large revenue base.
Cash conversion is strong, with a working-capital qualification. Suppliers and advance membership collections help finance activity. Growing payables can release cash as the business expands, but this mechanism is not unlimited. A slowdown, changes in payment terms or an inventory build can reverse the benefit. We therefore place more confidence in sustained operating profits and disciplined inventory than in a single year's cash-flow growth rate. FCF after expansion spending is the relevant distributable-cash starting point; maintenance-only cash flow would require assumptions that are not disclosed here.
The balance sheet is strong. Cash and investments exceed reported financial debt, providing flexibility for property investment and shareholder returns. Lease obligations, member rewards and supplier liabilities still matter; net financial cash is not a complete enterprise-risk measure. Our interpretation is that refinancing risk is secondary to operating execution and valuation. Cash accumulation does not, by itself, make a high equity multiple inexpensive.
Capital allocation should be assessed against incremental warehouse returns. New sites need time to mature, and nearby openings can shift sales from existing locations. Property investment can improve strategic control while consuming cash upfront. Repurchases can offset compensation dilution, but buying expensive shares offers less economic benefit than the same spending at a lower multiple. A special dividend is not assumed in our earnings or cash-flow scenarios.
A reproducible business-to-value bridge
The following is a deliberately simplified sensitivity, not a full forecast. Start with FY2026 net sales of USD 297.247 billion. Assume 7% comparable-sales growth and an effective 2% incremental sales contribution from new capacity after opening timing and cannibalization. Multiplying 297.247 × 1.07 × 1.02 produces approximately USD 324.415 billion of merchandise sales. The 2% assumption is an economic sales contribution, not a disclosed warehouse-count target.
Assume fees grow 8% to USD 6.380 billion. Total modeled revenue becomes USD 330.795 billion. At a 3.90% operating margin, modeled operating income is USD 12.901 billion. Holding net other income at USD 0.566 billion and using a 25% tax rate gives approximately USD 10.100 billion of net income. Dividing by 444.427 million annual diluted shares gives EPS of approximately USD 22.73, or about 9.5% growth. Holding other income and shares constant is a simplifying assumption that needs revision if rates or dilution change.
For cash, assume OCF equals 1.60x modeled net income and capex is USD 7.0 billion. This gives OCF of approximately USD 16.160 billion and FCF of USD 9.160 billion. At the reference equity value, modeled FCF yield is about 2.18%. Multiplying modeled EPS by 40x gives approximately USD 909.06 per share. This operating bridge is distinct from the earlier 12% EPS sensitivity: even strong sales can coexist with slower cash growth when capital needs rise.
The lesson is that comparable sales must generate profitable volume and cash after reinvestment. For the thesis to improve materially, operating leverage or fee economics need to deliver more than this simplified bridge assumes, or the entry valuation needs to decline. The single most important variable is underlying comparable sales sustained over several releases. That variable influences store productivity, expense absorption, member value and ultimately the credibility of the premium multiple.
4. Industry and Competitive Landscape
The relevant market includes membership warehouse clubs, value-led mass merchants and digital fulfillment alternatives. Industry demand is shaped by household budgets, food and fuel prices, convenience and discretionary spending. Procurement scale helps obtain attractive merchandise costs, while inventory discipline and distribution density determine whether those advantages reach members economically. Market-share claims require a defined product, geography and denominator; this report makes no unsupported claim to a precise global retail share.
Table 4. Industry position and competitive consequences
|
Competitive arena
|
Evidence / scale
|
Beneficiary and valuation implication
|
|
Warehouse clubs
|
Costco 939 warehouses; BJ’s 267 clubs
|
Costco has the larger disclosed network; scale supports a premium
|
|
U.S. club shopping
|
Costco Q4 adjusted comps 7.2%; Sam’s 4.4% ex-fuel
|
Costco leads this approximate growth comparison; Sam’s remains a strong rival
|
|
Convenience and digital
|
Sam’s eCommerce +26%; BJ’s digital comps +30%
|
Competitors are winning convenience investment; Costco must defend engagement
|
|
General merchandise
|
Target comps +3.8%; digital +8.7%
|
Recovery increases competition; Target trails Costco in this period, rather than shrinking
|
Table 5. Target company and three competitors
|
Company / period
|
Revenue or sales, USD billion
|
Comparable-sales KPI
|
Digital KPI
|
Profit-quality check
|
|
Costco Wholesale Corporation / Q4 FY2026, 16 weeks
|
95.723
|
6.7% adjusted; U.S. 7.2%
|
+19.5% digitally-enabled
|
EPS 6.75; refund benefit 0.15
|
|
Walmart Inc. / Q2 FY2027, 13-week comp period
|
187.9
|
Walmart U.S. 2.6% ex-fuel
|
+23% global eCommerce
|
Adjusted EPS 0.81 includes refund effects
|
|
BJ’s Wholesale Club Holdings, Inc. / Q2 FY2026, 13 weeks
|
6.227
|
3.1% ex-gasoline
|
+30% digitally-enabled comps
|
EPS and adjusted EPS 1.36
|
|
Target Corporation / Q2 FY2026, ended August 1
|
26.54
|
|
+8.7% digital comps
|
EPS 4.11 includes refund benefit 1.65
|
Periods, channels and definitions differ: Costco has a 16-week quarter; Walmart and BJ’s comparable-sales periods cover 13 weeks. Costco removes gasoline-price changes and FX, while peer ex-fuel or ex-gasoline metrics exclude fuel sales. Digital growth measures also have different scope. These are approximate operating comparisons, not a normalized valuation league table. Walmart's Sam’s Club U.S. is a division of Walmart Inc., not a fourth independent company.
Costco and Walmart are the clearest operating winners in this comparison. Costco combines strong underlying club demand with scale; Walmart combines broad distribution with convenience and additional profit streams. Their models can win simultaneously because value shopping is not a single-company opportunity. The direct threat to Costco is a competing offer that combines compelling prices with lower shopping friction. Defending value through better execution is more credible than assuming loyalty makes convenience irrelevant.
BJ’s is a growing challenger rather than a failed competitor. Its smaller footprint offers room for site expansion, and its digital growth shows engagement. Costco's broader scale remains an advantage, but a smaller business can build density in attractive local markets. A regional competitive response may require price investment even if consolidated demand stays healthy. Absolute digital growth percentages do not prove that a smaller company has surpassed Costco's sales scale or cash economics.
Target is the relative growth laggard here, although it is recovering. Positive comparable sales and traffic prevent a blanket claim that it is losing customers absolutely. Its greater emphasis on discretionary differentiation makes it a useful substitution competitor but a less direct warehouse-club comparison. Its tariff-related profit boost also demonstrates why an adjusted label is insufficient to establish recurring earnings quality.
Our industry conclusion is that Costco remains a net beneficiary of demand for value and membership economics. Competition is likely to limit how much procurement and productivity gains can be retained as margin. That supports durable growth and a quality premium, but makes an ever-expanding valuation less persuasive. A shareholder needs both a resilient business and a starting price that leaves room for normal execution variability.
5. Key Risks
-
Underlying sales slow after calendar and fuel assistance. If adjusted comparable sales fall below 5% over successive releases, store productivity and expense absorption weaken. Earnings forecasts and the premium multiple can fall together.
-
Membership acquisition or renewal deteriorates. A sustained decline in regional renewal, slower paid-member growth or weaker Executive upgrades would reduce fee growth and the lifetime value of the relationship. Because renewal is lagged, deterioration may appear in spending before the reported rate.
-
Value reinvestment absorbs gross profit. If tariffs, wages or freight costs rise faster than purchasing savings, management may absorb costs to protect member trust. Lower retained margin limits EPS even when nominal sales grow.
-
Digital convenience becomes expensive to defend. If fulfillment growth requires subsidies, additional labor or fragmented orders, strong digital sales may create less incremental cash than investors expect. Competitors can pressure both service standards and customer acquisition economics.
-
Expansion costs outrun mature-site productivity. Delays, expensive real estate, low initial sales or cannibalization can lower returns on new warehouses. Capex growth would then reduce FCF while earnings benefits arrive later.
-
Working capital reverses. Inventory growth above sales or tighter supplier terms could consume cash. The apparent conversion strength would weaken without an equivalent deterioration in reported accounting earnings.
-
Valuation normalizes despite good operations. Higher required returns or slower expected compounding can reduce the multiple. At the current reference valuation, operational resilience provides limited protection against a large derating.
6. Monitoring Checklist
The thresholds below are research decision rules, not company guidance.
-
Underlying comps: 6–8% sustained over three releases supports the thesis; below 5% for two releases weakens it. Review holiday shifts as well as FX and fuel adjustments.
-
Membership growth: paid-member growth around 4% with fee growth above 8% supports continued monetization; materially slower growth in both weakens it.
-
Renewal: a sustained U.S./Canada rate below 92% or worldwide rate below 89% would be a warning. Interpret the lagged cohort definition before attributing the change to the latest quarter.
-
Operating margin: approximately 3.8–4.0% on total revenue supports steady leverage; below 3.7% without deliberate, productive reinvestment weakens the earnings bridge.
-
Cash and inventory: annual FCF near or above USD 9 billion supports financial flexibility; inventory growth persistently exceeding sales and OCF conversion below 1.4x net income would weaken cash-quality confidence.
-
Expansion spending: capex materially above the illustrative USD 7.0 billion assumption requires evidence of higher future productivity; the assumption is not an announced company budget.
-
Valuation: a lower multiple with preserved demand improves the equity case; price appreciation unsupported by higher normalized earnings worsens it. Track October sales on November 4 and Q1 FY2027 earnings on December 10, subject to IR schedule changes.
7. Sources
Information cutoff: October 9, 2026, Asia/Shanghai. The equity reference is the October 8 U.S. closing series. All scenario inputs are analyst assumptions; no paid consensus feed was used. Price feeds differ slightly in last-trade timing; the selected close is applied consistently. Reportable annual cash flow uses the final 10-K. LBank token quotes are separate instruments and are excluded from equity valuation.
Automatic selection compared Costco, Amazon and AMD after opening their official spot interfaces and checking entity mapping. Costco has no coverage entry inside the prior 90 days. Amazon has no recent repeat but lacks Costco's fresh trigger in this screen; AMD was covered August 5. Localized announcement retrieval was limited for AMD, while the English trading interface was accessible. Costco and Amazon interfaces were verified in Safari after web-fetch failures. Interface verification establishes the visible market and entity, not legal ownership rights or continuous availability.
-
-
-
-
-
-
COST Historical Prices (https://chartexchange.com/symbol/nasdaq-cost/historical/) — Cross-check; latest displayed trade USD 948.01 at 15:59:55 EDT differs from the selected closing series.
-
Q2 FY27 Earnings Release (https://corporate.walmart.com/content/dam/corporate/documents/newsroom/2026/08/20/walmart-releases-q2-fy27-earnings/q2-fy27-earnings-release.pdf) — August 20, 2026; Walmart and Sam’s Club U.S.; quarter ended July 31.
-
Walmart Releases Q2 FY27 Earnings (https://corporate.walmart.com/news/2026/08/20/walmart-releases-q2-fy27-earnings) — Underlying earnings growth and digital strategy context.
-
-
-
-
COSTON/USDT Spot Trading | LBank (https://www.lbank.com/trade/coston_usdt) — Safari trading interface opened October 9, 2026; pair, Stocks tag, token introduction and buy/sell controls visible. Token price is not the equity close.
-
-
-
-
-